导图社区 Practical skills for AS思维导图
- 43
- 0
- 0
- 举报
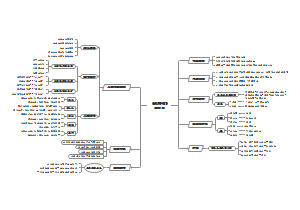
Practical skills for AS思维导图
Practical skills for AS 主要内容包含生物实验的设计、误差的种类等,生物实验设计,就是要求同学们能够根据实验原理,选择实验器材、安排实验步骤、进行数据处理及分析实验现象等。
编辑于2021-06-16 10:04:52- 生物实验
- 高等教育
- 出国留学
- 相似推荐
- 大纲


Practical skills for AS
Summary
skills
manipulation, measurement and observation
presentation of data and observations
analysis, conclusions and evaluations
questions
a ‘wet practical’
manipulating apparatus, perhaps making up and measuring out solutions, making measurements and observations, recording them and drawing
a biological structure
using a microscope, and recording your observations in the form of a diagram.
Experiments
investigating how one thing affects another
eg:the effect of enzyme concentration on the rate of activity of rennin
Rennin
clots milk; chymosin;is used commercially in cheese-making
Its substrate is casein;are dispersed in the milk as little micelles
Clotting:, splits the casein molecules into smaller molecules,which breaks up the micelles and causes the protein to clump together into small lumps, These lumps separate out from the liquid milk, producing the curd that can be made into cheese.

Variables and making measurements
eg:investigating the effect of the concentration of rennin on the rate at which it causes milk to clot
the independent variable -- the factor whose values you decide on, and which you change(The concentration of rennin )
the dependent variable--the variable which is not under your control; you do not know what its values will be until you collect your results(The rate at which the rennin causes the milk to clot )
standardised variables or controlled variables--all other variables that might aff ect the results are kept constant.
temperature
the type of milk used
pH
Changing the independent variable
the range of the independent variable(concentrations of rennin ranging from 0 to 1%)
in an examination, you will usually be given some clues that will help you to decide the range
the interval is the ‘gap’ between the values that you choose within the range(use concentrations of rennin of 0, 0.2, 0.4, 0.6, 0.8 and 1%,Th e interval would then be 0.2%)
Another possibility would be to use a series of values that are each one tenth of each other – 0.0001, 0.001, 0.01, 0.1 and 1.0
produce this range of concentrations by diluting the original solution
at least five values

Measuring the dependent variable
how to measure the dependent variable
determine the initial rate of reaction – taking measurements very quickly to find how much product has been formed, or how much substrate has disappeared, in the first minute or so of the reaction.
leave the reaction to take place until it has completely finished – that is, all the substrate has been converted to product – and record the time taken to do this.
time how long it takes to reach a clearly identifiable stage of the reaction, called an end-point.(the moment when you first see little clots remaining on the sides of the tube )
Controlling or changing other variables
Two variables which often crop up in experiments-- temperature and pH
Temperature
a water bath
1.Use a thermometer, held in the water and not touching the sides or base of the container, to measure the temperature. 2.read the thermometer while its bulb is still in the water. 3. allow time for their temperatures to reach the same temperature as the water 4.If you are doing an enzyme experiment, you may need to bring both the enzyme solution and the substrate solution to the same temperature before you add one to the other.
pH
buffer solutions
have a particular pH, and that keep that pH even if the reaction taking place produces an acidic or alkaline substance
measure pH using an indicator/pH meter
You may also need to explain how to change or control light intensity, windspeed or humidity.
Light intensity
vary the distance of a light source:light intensity is proportional to 1/distance^2
ensure that there is the only source of light for the weed.
varying light intensity is that the lamp will also produce a significant amount of heat, and this introduces another variable into your experiment: the temperature of the water surrounding the pondweed
Placing a transparent piece of plastic between the lamp and weed will allow light to pass through, but will greatly reduce the transmission of longer wavelength radiation, which will reduce the heating effect from the lamp.
Windspeed
investigating rate of transpiration
using a fan,which you can place at different distances from the plant
not be able to measure the actual windspeed.
Humidity
vary or control humidity when you are investigating rates of transpiration
be increased by placing a container of water close to the plant, or by covering the plant with a plastic bag.
be reduced by placing a container of calcium chloride close to the plant. Calcium chloride absorbs water vapour.
not be able to measure the actual humidity of the air.
Biological material
keep as many features as possible the same
age, storage conditions, genotype (including sex), mass, volume, position in the organism from which the sample was taken
Controls
where the factor that we are investigating is absent
the control is a tube that has no rennin in it. Everything else must be the same; a tube containing boiled rennin solution.
More about measurements – accuracy, precision and reliability
accuracy
accuracy
how ‘true’ it is
measuring a temperature--depend on whether or not the thermometer is perfectly calibrated.
precision
the ability of the measuring instrument to give you the same reading every time it measures the same thing
reliability
the degree of trust that you can have in it
is affected by both the accuracy and precision of your measuring instruments, and also by the kind of measurements that you are making
Recording quantitative results
You may be given a results table to complete, but often you will have to design and draw your own results table.
1.The table is drawn with ruled columns, rows and a border.
2.The columns are clearly headed with the quantity and its unit.
3.The results are organised in a sensible sequence.
4.The independent variable (rennin concentration) comes first, followed by the readings of the dependent variable (time taken to reach end-point).
5.Each measurement of the dependent variable is taken to the same number of decimal places.
6.The values calculated for the mean are given to the same number of decimal places as the individual readings.
7.the best thing to do about an anomalous result is to measure it again. However, if you can’t do that, then you should ignore it. Do not include it in your calculation of the mean.
8.An alternative way of recording this would be to record the time as infinite (symbol: ∞). This can then be converted to a rate like all the other results by calculating 1/time.Note that 1/∞ = 0
Constructing a line graph
The independent variable goes on the x-axis (horizontal axis), and the dependent variable on the y-axis (vertical axis).
Each axis is fully labelled, including the units.
The scale on each axis goes up in equal intervals
The intervals chosen make it easy to read intermediate values.
The scales cover the entire range of the values to be plotted, but don’t go too far above and below them. (Note that there is not always a need to begin your scale at 0.)
The points are plotted as neat, carefully placed crosses
A best-fit line has been drawn.
An alternative way to draw the line would be to join each point to the next one with a ruled, straight line
It is almost always incorrect to extend the line beyond the plotted points (extrapolate). it can sometimes be allowable to do this (eg: at point 0,0)
Describing data
1.Begin by describing the overall trend
2. Look for any changes in gradient on the graph, and describe these.
3. Quote figures from the graph
4. Take great care not to use phrases that suggest something is happening over time, if time is not shown on the x-axis.
eg:When no rennin was present, no end-point was reached (time taken = ∞), indicating that no reaction was taking place. At a concentration of 0.2% rennin, the end-point was reached in a mean time of 68.0 seconds. As the concentration of rennin increased, the mean time to reach the end-point decreased, with the shortest mean time (12.9 s) occurring at a concentration of 1% rennin. This indicates that the rate of reaction increases as the concentration of rennin increases.
eg:The line on the graph is a curve with decreasing gradient, not a straight line, so the relationship between concentration of rennin and the rate of reaction is not proportional (linear). The curve is steepest for the lower concentrations of rennin, gradually flattening out for the higher concentrations. This shows that a 0.2% increase in rennin concentration has a greater effect on reaction rate at low rennin concentrations than at high rennin concentrations.
Explaining your results
use your scientific knowledge to explain why the relationship you have found between your independent variable and your dependent variable exists.
Drawing
use a graticule to measure an object using a microscope, and perhaps to calculate its real size by calibrating the graticule against a stage micrometer
to show every step of your working clearly and fully
A good biological drawing
be drawn with clear, single lines
do not have several ‘goes’ at a line so that it ends up being fuzzy
use an HB pencil and a good eraser, so that when you make a mistake you can rub it out completely
show the overall shape, and the proportions of the different components of the structure you are drawing, accurately
not include shading or colouring
be large, using most of the space available but not going outside that space
a low-power plan (a plan diagram)
only the outlines of the different tissues are shown
never show individual cells; look carefully to determine where one tissue ends and another one begins
a highpower detail
show individual cells
label your drawings
drawn with a ruler and pencil, and the end of the line should precisely touch the part of the diagram you are labelling
Do not use arrowheads
The label lines should not cross over one another.

Identifying sources of error and suggesting improvements
Sources of error are unavoidable limitations of your apparatus, measuring instruments, experimental technique or experimental design
Uncertainty in measurements resulting from lack of accuracy or precision in the measuring instruments that you were using, and from the limitations in reading the scale --systematic errors.
Difficulties in controlling the standardised variables.These errors are likely to be different for different stages of your investigation--random errors.
Difficulties in measuring the dependent variable, due to human limitations --random errors.
suggest improvements
1.using measuring instruments that are likely to be more precise, accurate or reliable
2. using techniques for measuring the dependent variable that are likely to be more reliable
3.using techniques or apparatus that are better able to keep standardised variables constant
4.controlling important variables that were not controlled in the original experiment
5.doing repeats so that you have several readings of your dependent variable for each value of your independent variable, and then calculating a mean value of the dependent variable
Making calculations from data
It is very important to show every single step in any calculation that you make
eg:
even though your calculator will show an answer of 13.28, you must give your answer to only one decimal place, the same as for the original measurements.
A third type of calculation you could be asked to do is to find the percentage change
1.find the difference between the first reading and the second reading, by subtracting one from the other
2 divide this value by the first reading, and multiply by 100

Estimating uncertainty in measurement
In general, the potential error in a measurement is half of the value of the smallest division on the scale you are reading from.

the size of the error as a percentage
the temperature rise was measured as 10.5 °C, and the error was ±1 °C. Therefore: percentage error = (1 ÷ 10.5) × 100 = 9.5%
Errors in measurement are not the only important sources of error in biology experiments
Constructing bar charts and histograms
A bar chart
when you have a discontinuous variable on the x-axis and a continuous variable on the y-axis.
A discontinuous variable is one where there is no continuous relationship between the items listed on the scale.

A continuous variable is one where there is a smooth, numerical relationship between the values--a histogram, or a frequency diagram

Making conclusions
a simple, well-focused and clear statement describing
The conclusion should relate to the initial question you were investigating or the hypothesis you were testing.
eg:The greater the concentration of rennin, the shorter the time taken to reach the end-point. An increase in rennin concentration increases the rate of reaction
1.collect data and make observations 2.make decisions about measurements and observations 3.record data and observations appropriately 4.display calculations and reasoning clearly 5.use tables and graphs to display data 6.interpret data or observations 7.identify significant sources of error 8.draw appropriate conclusions from data 9.suggest appropriate improvements to experiments