导图社区 CFA Lv2 数量
- 118
- 0
- 0
- 举报
CFA Lv2 数量
CFA 2级 数量 框架图 习题,通过这份框架图习题集的练习,考生可以系统地复习和巩固CFA二级数量分析的所有重要内容,提高解题速度和准确率。无论是对于初次备考CFA二级的考生,还是对于希望进一步提升自己数量分析能力的金融从业人士,这份习题集都将是一个不可或缺的得力助手。
编辑于2024-10-07 07:43:25- CFA
- 框架图
- 数量
- 习题
- 2级
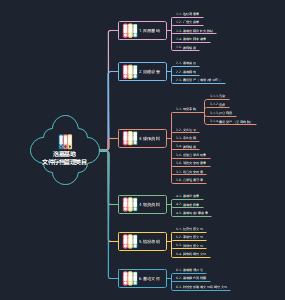
- CFA Lv2 道德
CFA 2级道德思维导图习题,包含I. Professionalism、II. Integrigy of Capital Markets、III. Duties to Clients、IV. Duties to Employers。
- CFA Lv2 另类
CFA 2级 另类 思维导图 习题,包含M1 Introduction to Commodities and Commodity Derivatives、M2 Overview of Types of Real Estate Investment、M3 Publicly Traded Securities。
- CFA Lv2 衍生品
CFA 2级 衍生品 框架图 习题,包含Key Concepts、M1 Pricing and Valuation of Forward Commitments、M1 Pricing and Valuation of Forward Commitments等。
CFA Lv2 数量
社区模板帮助中心,点此进入>>
- CFA Lv2 道德
CFA 2级道德思维导图习题,包含I. Professionalism、II. Integrigy of Capital Markets、III. Duties to Clients、IV. Duties to Employers。
- CFA Lv2 另类
CFA 2级 另类 思维导图 习题,包含M1 Introduction to Commodities and Commodity Derivatives、M2 Overview of Types of Real Estate Investment、M3 Publicly Traded Securities。
- CFA Lv2 衍生品
CFA 2级 衍生品 框架图 习题,包含Key Concepts、M1 Pricing and Valuation of Forward Commitments、M1 Pricing and Valuation of Forward Commitments等。
- 相似推荐
- 大纲

CFA Lv2 数量
Module 1 Basics of Multiple Regression and Underlying Assumptions
Basic concepts
例题
Cambo would like to understand how the ETF's back tested returns are influenced by a set of underlying factors. He estimates a regression of monthly excess returns (RET) against three factors: the market excess return (MRKT), the difference in returns between value and growth stocks (HML) and the difference in returns between small and large-cap stocks (SMB). Summary output of the multiple regression is provided in Exhibit 2. Cambo then estimates RET for an out-of-sample observation, assuming MRKT is 0.9%, the return on value stocks is 1.2%, the return on growth stocks is 3.8%, the return on small-cap stocks is 4.0%, and return on large-cap stocks is 2.2%. Based on Exhibit 2, all returns are stated in whole percentages (that is, 1.00 for 1.00%), the predicted value of RET for the out-of-sample observation is closest to: A. 4.21%. B. 1.01%. C. 1.87%.
C is correct. RET = Intercept+b1×MRKT+b2×HML+b3×SMB RET = 0.035+1.56×0.9+0.45×(1.2-3.8)+0.89×(4-2.2)=1.87%
这题特别简单,但是特别经典,必须掌握。所以给最高优先级。
例题
In the regression of the returns of BOLSAA.MX against the USD/MXN exchange rate (Exhibit 1), the coefficient of the USD/MXN exchange rate is most accurately described as: A. indeterminate because Exhibit 1 provides insufficient information. B. significantly different from zero. C. not significantly different from zero.
答案:B 解析:B is correct. A two-tailed t-test is appropriate to test whether the coefficient is significantly different from zero. The test statistic is the estimate of the coefficient (–0.5789) divided by its standard error (0.2221), –0.5789/0.2221 = –2.61. Because –2.61 is less than –2.00 (the negative critical value for the two-tailed test), the coefficient is significantly different from zero at the 5% level of significance. A is incorrect. The coefficient is significantly different from zero based on a t-test. C is incorrect. The coefficient is significantly different from zero based on a t-test.
注意t-stat不给,是可以自己求出来的
Assumptions
Linearity
Independence of independent variables: a&b
Homoskedasticity
例题
Interpreting the graph, Reyes states: The presence of heteroskedasticity is indicated when there is a systematic relationship between the values of the residuals and the independent variable. As shown in Exhibit 2, there is no systematic relationship between the BOLSAA residuals and the USD/MXN exchange rate. Therefore, heteroskedasticity does not appear to be a problem in this regression. Reyes's interpretation of the graph in Exhibit 2 is best described as: A. correct. B. incorrect, because the effects of heteroskedasticity are, in a regression such as this one, hidden by the negative slope of the regression line. C. incorrect, because heteroskedasticity is indicated when there is not a systematic relationship between the residuals and the independent variab
答案:A 解析:A is correct. The presence of heteroskedasticity is indicated when there is a systematic relationship between the residuals and the independent variable. The graph in Exhibit 2 displays no systematic relationship. Therefore, heteroskedasticity does not appear to be a problem in this regression. B is incorrect. The slope of the regression line is irrelevant to the issue of heteroskedasticity. C is incorrect. It states that the lack of a systematic relationship suggests heteroskedasticity
方差和自变量没有相关性,说明是同方差!
Independence of errors
Normality
Q-Q plot
例题
Next, Johanson inspects the residuals of the regression in order to determine whether Model 1 is correctly specified. In particular, she constructs a Q-Q plot and notes that the residuals do not appear to align well on the diagonal of the plot. She also performs another diagnostic test, finding that the residuals are uncorrelated across observations. Based on Johanson's observations regarding the residuals from Model 1, which of the following regression assumptions is most likely violated? A. Normality B. Homoskedasticity C. Independence of errors
知识点散点图
X和Y
检查X和Y的线性关系
残差和E(Y)
同方差
残差和X
Outliers
Q-Q
残差正太分布
这里画的是Q-Q,所以是检查散点图的正太
自变量独立,残差独立同分布
Module 2 Evaluating Regression Model Fit and Interpreting Model Results
Hypothesis tests for coefficients
t-test on slope coefficient
F-test for joint test of slope coefficients
unrestricted model
all independent variables
restructed model
excluding subset of variables
F = ((Restricted SSE - Unrestricted SSE) / q) / Unrestricted MSE
例题
Calculate the joint F-statistic and determine whether SMB and MOM together contribute to explaining RET in Model 3 at a 1% significance level (use a critical value of 4.849). A. 2.216, so SMB and MOM together do not contribute to explaining RET B. 8.863, so SMB and MOM together do contribute to explaining RET C. 9.454, so SMB and MOM together do contribute to explaining RET
B is correct. To determine whether SMB and MOM together contribute to the explanation of RET, at least one of the coefficients must be non-zero. So, H0: bSMB = bMOM = 0 and Ha: bSMB ≠ 0 and/or bMOM ≠ 0. We use the F-statistic with q = 2 and n – k – 1 = 90 degrees of freedom. The test is one-tailed, right side, with α = 1%, so the critical F-value is 4.849. Model 1 does not include SMB and MOM, so it is the restricted model. Model 3 includes all of the variables of Model 1 as well as SMB and MOM, so it is the unrestricted model. Using data in Exhibit 1 and Exhibit 3, the joint F-statistic is calculated as F = ((1087.618-908.647)/2)/(908.647/90)=8.863392 Since 8.863 > 4.849, we reject H0. Thus, SMB and MOM together do contribute to the explanation of RET in Model 3 at a 1% significance level
如果记不住公式,记住性质也行,大除小。
例题
The null hypothesis of F-test can mostly likely be stated as: A. all slope coefficients are simultaneously equal to zero. B. at least one slope coefficient is equal to zero. C. at least one slope coefficient is non-zero.
正确答案:A 解析:F检验的原假设是所有的回归系数都等于0,备择假设是至少有一个回归系数不等于0。
送分题
Goodness of Fit
R-square & Adjusted R-Square
R^2 = SSR/SST
Problems
cannot provide view on coefficients
cannot provide view on biases in predictions
cannot tell fitness of model
Adjusted R^2
If coefficient's t-stat > |1|, adjusted R^2 increases
例题
Steven uses the coefficient of determination (R²) to decide whether an additional variable should be added into a regression. But Tom thinks the measure is not appropriate and recommends adjusted R² because: A. R² must decrease when adding another variable. B. adjusted R² adjusts degrees of freedom for adding another variable. C. adjusted R² automatically increases when adding another variable
正确答案: B 解析:该题主要考点为多元回归中的R²和adjusted R²。 只要加入一个新的自变量,R²必定会增大,所以不适合用来判断是否应该加入新的自变量,但是adjusted R²经过自由度的调整,加入新变量后,可能会增大,也可能会减小,所以正确选项为B。
送分题
Both R^2 and adjusted R^2, the higher, the better
AIC & BIC
AIC
for prediction
例题
Johanson runs a series of regressions covering all possible combinations of the three ESG scores as independent variables. She then computes Akaike's information criterion (AIC), and Schwarz's Bayesian information criterion (BIC) for each regression. Johanson's goal is to find the model specification that is best for out-of-sample prediction. The results are presented in Exhibit 2. Based on Exhibit 2, the combination of independent variables that achieves Johanson's goal is: A. G only. B. E and S only. C. E, S, and G.
B is correct A. Incorrect because it has the highest, not the lowest, value of AIC. A candidate who assumes that a higher value of AIC is preferred may select this answer choice. The specification with G only also has the highest value of BIC and may be selected for this reason, too. B. Correct because Akaike's information criterion (AIC) and Schwarz's Bayesian information criteria (BIC) are used to evaluate model fit and select the "best" model among a group with the same dependent variable. AIC is preferred if the purpose is prediction, BIC is preferred if goodness of fit is the goal, and lower values of both measures are better. The model specification with E and S only has the lowest value for AIC (1,465.3) out of all models considered in Exhibit 2, and hence is "best" if prediction is the goal of the analysis. This also corresponds to the same variables that were found to be statistically significant in Exhibit 1. C. Incorrect because the AIC for this specification (1,465.8) is higher (i.e., worse) than for the model specification with E and S only (which has an AIC of 1,465.3). Since AIC is preferred if the purpose is prediction and lower values are better, the model specification with E and S only is "better".
AIC用来判断prediction
越小越好
BIC
For best fit
more penalty than AIC
例题
Which of the following statements regarding the measurement indicators for the model's fit is least likely accurate? A. There is no exact interpretation of the adjusted in a multiple regression with regard to the percentage of the dependent variable's variation explained. B. Akaike's information criterion (AIC) is a good measure of model parsimony, with lower AIC indicating a better-fitting model. C. Schwarz's Bayesian information criterion (BIC) tends to apply a smaller penalty for having more parameters in a model than AIC.
正确答案: C 解析:该题主要考点为模型拟合性的计量指标。 相比于AIC,BIC对模型引入过多的参数会施加更多的惩罚。因此,C选项描述错误,符合题意,为正确选项。 对于选项A,调整R平方无法表征因变量变异性被自变量解释的百分比。因此,该选项描述正确,不符合题意,为错误选项。 对于B选项,AIC用于度量模型的简约性,较低的AIC意味着拟合性更好的模型。因此,该选项描述正确,不符合题意,为错误选项。
送分题
例题
Jan Cambo is a data analyst at an US asset management firm which manages a wide range of index funds and ETFs. Cambo wants to identify the macroeconomic factors that best explain the returns on local stock market index, the SPX500. Based on the information in Exhibit 1, he evaluates how many factors he should incorporate in his final model and selects the best-fitting model.
Which of the following models has the best fit? A. 3-factor model B. 4-factor model C. 5-factor model
B is correct. AIC is preferred if the model is used for prediction purposes. BIC is preferred when the best goodness of fit is desired. 4-factor model has lowest BIC thus, the 4-factor model has the best fit.
越小越好
Best fit: BIC
Prediction: AIC
单元回归: R^2
多元回归: Ajusted R^2
Both AIC and BIC, the lower, the better
Forecasting using multiple regression
ANOVA
Module 3 Model Misspecification
Model specification errors
例题
In completing their review of the previous model, Knoller cautions the analysts to be aware of the various types of uncertainty that can arise when predicting the dependent variable using a linear regression model. She identifies two errors that result in the forecast of the dependent variable having a standard error larger than the standard error of the regression: Error1: Model error Error 2: Sampling error Is Knoller correct about the errors affecting the standard error of the forecast of the dependent variable? A.Yes B.No, she is incorrect about Error 1 C.No, she is incorrect about Error 2
Solution:B A.Incorrect because "when predicting the dependent variable using a linear regression model, we encounter two types of uncertainty: uncertainty in the regression model itself, as reflected in the standard error of estimate, and uncertainty about the estimates of the regression model's parameters." "In any regression estimation, there are residuals because not all observations lie on the estimated line. This is basic uncertainty in the model—the model error—which is the stochastic part of the model that involves the regression residual, εi. When the independent variables themselves are forecasts and thus out-of-sample predictions, there is an added source of error arising from errors associated with forecasting the independent variables. In such cases, the forecast error for the dependent variable is dependent on how well the independent variables (X1f, X2f, …, Xkf) were forecasted, hence introducing sampling error. The combined effect of the model error and the sampling error results in a standard error of the forecast for Ŷf that is larger than the standard error of the regression. This larger forecast error results in a prediction interval for the dependent variable that is wider than the within-sample error. B.Correct because Error 1, model error, works to increase the forecast interval (standard error) for the dependent variable. "when predicting the dependent variable using a linear regression model, we encounter two types of uncertainty: uncertainty in the regression model itself, as reflected in the standard error of estimate, and uncertainty about the estimates of the regression model's parameters." R2 measures the goodness of fit of a regression model, or the percentage of variation in the dependent variable that can be explained by the independent variables. It does not reflect the model uncertainty. C.Incorrect because Error 2, sampling error, works to increase the forecast interval for the dependentvariable. "when predicting the dependent variable using a linear regression model, we encounter two types of uncertainty: uncertainty in the regression model itself, as reflected in the standard error of estimate, and uncertainty about the estimates of the regression model's parameters."
Predicted Y和actual Y的误差有2个原因: 1. Model error: error(i) 和 b(i)之间的误差 2. sampling error: predicted X的误差 题目问的是为什么预测的大于standard error of regression,也就是为什么1+2>1,所以因为有2. 所以1会导致1+2>1是不对的。 本质上,这题是理解了后的,阅读理解题。
例题
John uses logistic regression to train the model: Defaulting loans are classified as Class 1, and non-defaulting loans are classified as Class 0. After tuning, the threshold p-value of 0.6 (for Class 1) is used to predict the outcome for each loan application. Exhibit 2 shows the result. Based on Exhibit 2, the most appropriate statement about the model's performance for the selected credit applicant is that it results in: A. a Type I error. B. a Type II error. C. the correct classification.
A is correct The threshold p-value for Class 1 (default) is 0.6, which has met (p = 0.65); thus, the final ML model predicts that the applicant would be a defaulter (Class 1). The loan has been misclassified as being likely to default when it non-default. This is a Type I error (a false positive).
2分类只有2类,1和0。一般1是Positive。
predict分positive和negative
actual分true和false
false是错误,positive是type 1 error,negative是type 2 error
题目p=0.65>0.6,不拒绝。positive,1。
Actual是0,说明false。
false positive = error 1
Misspecified functional form
Omitted variables
Inappropriate form of variables
Inappropriate scaing of variables
Inappropriate pooling of data
Violations of regression assumptions
conditional heteroskedasticity
Consequence: type 1
Detection: BP, reject 表示存在
例题
Cambo would like to understand how the ETF's back tested returns are influenced by a set of underlying factors. He estimates a regression of monthly excess returns (RET) against three factors: the market excess return (MRKT), the difference in returns between value and growth stocks (HML) and the difference in returns between small and large-cap stocks (SMB). Summary output of the multiple regression is provided in Exhibit 2. Cambo then estimates RET for an out-of-sample observation, assuming MRKT is 0.9%, the return on value stocks is 1.2%, the return on growth stocks is 3.8%, the return on small-cap stocks is 4.0%, and return on large-cap stocks is 2.2%. Cambo determines if his regression conforms to multiple regression assumptions. He calculates the Breusch-Pagan (BP) test statistic to be 5.8 for his model. Critical values for the statistic are presented in Exhibit 3 (Probabilities in Right Tail). If Cambo assumes a significance level of 5%, based on the result of the BP test he should conclude that the: A. statistics of the independent variables are unreliable. B. residuals do not exhibit conditional heteroskedasticity. C. standard errors are underestimated.
B is correct The Breusch-Pagan (BP) test is a one tail (right tail) test, the number of independent variables k is 3, with a significance level 5%, the critical value is 7.815 which exceeds BP test statistic 5.8, thus, we cannot reject the null hypothesis, the regression model does not have conditional heteroskedasticity and the standard errors of regression coefficient are unbiased.
BP检验看异方差,A和条件异方差无关
查表,3个变量,自由度是3,得到0.05的关键值是7.815,大于5.8,无法拒绝,B错误。
标准误被低估说明模型错误,有条件异方差,但是此题无法拒绝,所以没条件异方差,标准误也没被低估,C错误。
例题
Your supervisor is concerned about conditional heteroskedasticity in Model 3 and asks you to perform the Breusch–Pagan (BP) test. At a 5% confidence level, the BP critical value is 11.07. You run the regression for the BP test; the results are shown in Exhibit 1. Calculate the BP test statistic using the data in Exhibit 1 and determine whether there is evidence of heteroskedasticity. A. 1.264, so there is no evidence of heteroskedasticity B. 6.251, so there is no evidence of heteroskedasticity C. 81.792, so there is evidence of heteroskedasticity
答案:B 解析: B is correct. The BP test statistic is calculated as nR2, where n is the number of observations and R2 is from the regression for the BP test. So, the BP test statistic = 96 × 0.06511 = 6.251. This is less than the critical value of 11.07, so we cannot reject the null hypothesis of no heteroskedasticity. Thus, there is no evidence of heteroskedasticity
虽然理论上考BP的定量概率不大,但是mock的确有出现这题,并且BP公式也不难记,所以还是建议记一下
Correction: rebust error
例题
Statement I: Unconditional heteroskedasticity creates major problems for statistical inference while conditional heteroskedasticity does not. Statement II: An F-test is usually used to detect the presence of heteroskedasticity. Statement III: With heteroskedasticity present in the regression, the standard errors of the slope coefficients are most likely underestimated (especially with financial data), and Type I error may occur Which of Yoki's statements about heteroskedasticity is most likely correct? A. Statement I B. Statement II C. Statement III
正确答案:C 解析:异方差分为条件异方差和非条件异方差,其中非条件异方差一般不会造成大问题,而条件异方差则一般会导致回归系数的标准误被低估,从而使t检验统计量偏大,使本来不能拒绝原假设的情况变成拒绝原假设,可能犯第一类错误。检验异方差是否存在一般使用Breusch-Pagen χ² 检验。
异方差比较致命的是条件异方差 除了多重哦共线性是2类错误,其他2个都是1类错误
serial correlation
consequence: type 1
正相关是1类,真实时间都是正相关
Detection:
1st order: DW
例题
Johnson reviews Knight's forecast and states: Statement 1) As long as the R2 is high, we can be comfortable that the model is a good fit for our analysis. Statement 2) A statistically meaningful low Durbin-Watson statistic indicates that the errors in the model may exhibit positive serial correlation. Statement 3) If Rudall Hardware's sales are growing at a constant rate, a linear trend model may be a better fit than a log-linear model. Which of Johnson's statements relating to Knight's forecasted future sales for Rudall Hardware is most likely correct? A. Statement 1 B. Statement 2 C. Statement 3
正确答案:B A.Incorrect. Even if the R2 is high, this trend model is not appropriate if the errors are serially correlated. B.Correct. A statistically significant low Durbin-Watson statistic indicates that the errors in the model may exhibit positive serial correlation. C.Incorrect. If sales were growing at a constant dollar amount a linear trend model would be more appropriate, but with a constant rate of growth a log-linear model is a better fit.
DW显著说明序列相关
例题
When applying the first-order autoregressive model, Knight wants to conduct some tests to ensure the model is producing meaningful results. In order to do this, Knight comments that he must test whether the: Test 1: Durbin-Watson statistic differs significantly from 2. Test 2: residual autocorrelations differ significantly from 0. Test 3: intercept and coefficient on the first lag differ significantly from 0. Of the three tests Knight indicates he would like to conduct for the first-order autoregressive model, which is most likely appropriate to test for serial correlation in the model? A. Test 1 B. Test 2 C. Test 3
正确答案:B A. Incorrect because the Durbin-Watson statistic is invalid when the independent variable includes past values of the dependent variable. B. Correct. This is the correct approach to test if the residuals in an autoregressive model are serially correlated. C.Incorrect. We may test the significance of the coefficients to see if they are significantly different from 0, but to test for for serial correlation we must test the residuals
DW只能在trend model和多元回归检验自相关,不能用在AR(1)
AR(1)检验自相关应该用t-stat
C是检验系数显著性,和自相关无关
例题
In Exhibit 1, at the 5% significance level, the lower critical value for the Durbin-Watson test statistic is 1.75 for both the linear and log-linear regressions.Based on the regression output in Exhibit 1, there isevidence of positive serial correlation in the errors in. Exhibit 1: Regression Statistics (t-statistics for coefficients arereported in parentheses) Durbin-Watson: Linear: 0.1; Log-Linear: 0.08; AR(1): 0.16; AR(2): 2.08 A. the linear trend model but not the log-linear trend model. B. both the linear trend model and the log-linear trendmodel. C. neither the linear trend model nor the log-linear trendmodel.
B is correct 解析: DW的原假设是没有相关性,题目给的是lower critical value is 1.75,而表格中都低于1.75,所以应该拒绝原假设。拒绝没有相关性,说明有相关性,选B。
【PS】DW的原假设是没有相关性,而不是有相关性。Correlation = 0,这个等号在原假设,而不是有相关性的“有”在原假设。
【PS2】注意题目给的是lower critical value,所以t-stat应该>=1.75,我们这里应该拒绝的是所有<1.75的,所以两个都应该拒绝。
General: BG
例题
Now the chief investment officer (CIO) joins the meeting and asks you to analyze two regression models (A and B) for the portfolio he manages. He gives you the test results for each of the models, shown in Exhibit 2. Identify the type of error and its impacts on regression Model A indicated by the data in Exhibit 2. A. Serial correlation, invalid coefficient estimates, and deflated standard errors. B. Heteroskedasticity, valid coefficient estimates, and deflated standard errors. C. Serial correlation, valid coefficient estimates, and inflated standard errors.
答案:A 解析: A is correct. The Breusch–Godfrey (BG) test is for serial correlation, and for Model A, the BG test statistic exceeds the critical value. In the presence of serial correlation, if the independent variable is a lagged value of the dependent variable, then regression coefficient estimates are invalid and coefficients' standard errors are deflated, so t-statistics are inflated.
BG用来检测自相关 如果有自相关,模型的系数就会有问题。并且error会变小,t-stat会变大
Correction: rebust error
例题
Cedric and Yoki discuss about another common regression assumption violation – serial correlation. Cedric states, "Serial correlation refers to that residuals of the regression are correlated with one another and typically arises in time-series regressions." Yoki adds, "Serial correlation can be either positive or negative. When positive serial correlation exists, the standard errors of the slope coefficients may be overestimated and Type II error tends to occur, and it is the other way around when negative serial correlation is present." Whose statement about the serial correlation is least correct? A. Cedric's B. Yoki's C. Both Cedric's and Yoki's.
正确答案:B 解析:序列相关指的是残差项之间有相关性,在时间序列回归中比较常见,Cedric的描述正确;序列相关分为正的序列相关和负的序列相关,正序列相关会低估回归系数标准误,可能会犯第一类错误,负序列相关会高估回归系数标准误,可能会犯第二类错误,Yoki的描述错误。
正相关一类错误,负相关二类错误
multicollinearity
consequence: type 2
Detection: VIF > 10
Correction: exclude variable; different proxy; increase sample size
增加样本量是万能药
例题
The data provider that publishes the ESG scores used by Johanson also produces a composite score that incorporates all three ESG pillars into a single variable (denoted ES&G). Johanson considers whether adding ES&G as an additional independent variable in her original model (Model 1) will improve the model's performance. She estimates the resulting regression model (Model 2) and finds that all four estimated slope coefficients are statistically insignificant, but the F-statistic for the overall regression is statistically significant (with a p-value of 0.01). Based on the results of Model 2, which of the following specification errors is most likely to be present? A. Multicollinearity B. Omitted variable bias C. Conditional heteroskedasticity
A is correct A. Correct because the regression results for Model 2 have a significant F-statistic but insignificant t-statistics for each individual slope parameter. The classic symptom of multicollinearity is a high R2 and significant F-statistic, but t-statistics for the individual estimated slope coefficients that are not significant due to inflated standard errors. B. Incorrect because there is no clear evidence in the regression results presented of omitted variable bias, the bias resulting from the omission of an important independent variable from a regression. The presence of omitted variable bias is not easily detected since the list of potentially omitted variables is large. However, the high R2 and low t-stats observed are a classic symptom of multicollinearity. C. Incorrect because there is no clear evidence of conditional heteroskedasticity in the regression results presented. Conditional heteroskedasticity is when the error variance is correlated with (conditional on) the values of the independent variables. In fact, if there is conditional heteroskedasticity in the estimated model, we tend to find significant relationships where none actually exist (since standard errors are underestimated and t-statistics inflated). Exactly the opposite is found in the estimation results for Model 2, where the model overall is significant but the individual slope coefficients are insignificant.
多重共线性的特点是R^2大,F显著,但是T不显著
遗漏变量不容易被发现,一般不选
异方差一般用BP
例题
Epstein remarks that the model is fine, but it doesn’t seem particularly unique. Additionally, she is concerned as to whether it matters that some of the variables, such as dividend yield and reinvestment rate, appear to be related to each other. Epstein's concern regarding the relationship between the dividend yield and the reinvestment rate variables is most appropriately addressed by evaluating the: A. 2 and t-statistics. B. Durbin–Watson statistic. C. Breusch–Pagan test results.
A is correct. The concern that Epstein has in regard to the relationship between the dividend yield and the reinvestment rate is that the two independent variables are likely highly correlated with one another—which is referred to as multicollinearity. There is no specific test for multicollinearity. However, it can be identified by large values and significant F-statistics, combined with low or insignificant tstatistics due to inflated standard errors. B is incorrect. The Durbin–Watson statistic is used to test for serial correlation. C is incorrect. The Breusch–Pagan test is used to diagnose heteroskedasticity.
多重共线性一般有2种办法,一个是t test不显著,F test显著,说明自变量一起可以解释。另外一个就是VIF>10。R^2虽然不是特别好,但是当添头吧。3个选个最好的。 DW看error自相关。 BP看error异方差。
例题
Possible solutions for addressing the multicollinearity issues identified in Exhibit 3 include: 1. excluding one or more of the regression variables. 2. using a different proxy for one of the variables. 3. increasing the sample size. A. Only Solution 1 is correct. B. Only Solution 2 is correct. C. Solutions 1, 2, and 3 are each correct.
C is correct Possible solutions for addressing multicollinearity issues include all of the solutions mentioned: excluding one or more of the regression variables, using a different proxy for one of the variables, and increasing the sample size. 解析: 现实中做回归分析的时候,如果变量之间多重共线性太强,会让我们的模型估计不准确,参数也可能变得不稳定,这就好比是你试图在一条腿上保持平衡,而这条腿还不停晃动一样。 怎么解决呢?这三种方法都是可行的: 1. 排除一个或者多个回归变量。这个方法简单粗暴,如果你发现有几个变量高度相关,那你可以尝试移除一个或者几个,留下其他的。这就像是你去超市买水果,但包里装不下这么多,你就得挑几个最想吃的留下,其他的放回去。 2. 使用不同的代理变量。如果你不想剔除变量,那就换个角度来描述它们。比如说,你要分析房价,本来用的是建筑面积和卧室数量两个变量,但它们存在共线性。你可以换个角度,用楼层高度作为代理变量,这可能就能降低共线性。这有点像是你想描述一个人很强壮,本来想说他能举多重的哑铃和他多高,结果发现这两个通常是相关的,那你就改说他能跑多快,这样也能体现出他的强壮,但就避免了重复。 3. 增加样本量。有时候,数据点不够多会造成共线性问题显得更严重。如果你能够收集更多的数据,这样可以提高模型的稳定性。这就像是你要烤个蛋糕,但是只放了一个鸡蛋,结果太薄了,不够结实。如果你放更多的鸡蛋,蛋糕就更稳固,更能承受压力。
Module 4 Extensions of Multiple Regression
Influence analysis
Influential data points
Detecting
Leverage (hii): independent variable
extreme independent variable
hii > 3(k+1)/n
Studentized residual: dependent variable
extreme dependent variable
|t-stat| > 3
例题
There are 96 observations and two independent variables (k = 2), and the critical t-statistic is 2.63 at a 1% significance level. Partial results of your calculations are shown in Exhibit 1. Determine and justify the potentially influential observations in Exhibit 1 using the studentized residuals measure. A. Observations 1 and 92, because the values of their studentized residuals exceed 2.63 B. Observations 1, 6, 50, and 92, because the absolute values of their studentized residuals exceed 2.63 C. All the observations shown except observation 95, because the absolute value of its studentized residual is less than 0.094
B is correct 解析: 对于学生化残差测量,临界 t 值为 2.63。因此,任何具有“绝对值”超过 2.63 的学生化残差的观测值都是潜在影响的观测值。所以选B。
【PS1】如果临界 t 值大于3,则用3而不是临界t值来做比较。
【PS2】如果不是学生化残差,而是hii,则用3((K+1)/n)来做比较。
【PS3】如果不是学生化残差,而是Cook's D,则用2 * (K/n)^0.5 来做比较。Cook's D的计算公式在最新考纲中被拿走。
【PS4】如果比较monthly seasonality,则用新回归的Significant F的p值和α来比较。
Cook's D: indepeendent & dependent variable
3个都找大的
Qualitative variables
probit model
例题
Epstein asks Litvenko whether it is possible to identify companies that are likely to outperform the market in the next period rather than just trying to predict the return for a company. He replies that his model as stated would not be a suitable approach for identifying outperformers, but there are ways to conduct such an analysis. The most appropriate way to address the outperformance issue discussed by Epstein and Litvenko is to: A. use a probit model. B. add a dummy variable to the regression. C. replace one or more of the independent variables with its logarithmic transformation.
A is correct. A probit model is appropriate for a binary decision, such as whether a security is likely to outperform the market or not. B is incorrect. A dummy variable is a qualitative independent variable. A model to classify outcomes as binary requires a qualitative dependent variable. C is incorrect. A logarithmic transformation of an independent variable is appropriate when its relationship with the dependent variable is non-linear, but it will not change the form of the dependent variable to binary (outperforms or does not).
这题的关键的理解题目,题目问的是outperform,其实不是问跑赢市场多少,而是问是否跑赢。所以相当于对Y进行0和1的判定。所以应该用Probit model。 Dummy variable是对X进行0和1的判定。 logarithmic transformation和这题没关系,一般是X太大了,未来减少极端值的干扰,所以先做Log,让整体更扁平。
Dummy/qualitative independent variables
Qualitative dependent variables
Logistic regression (logit)
Likelihood ratio: the higher, the better
Ln(p/(1-p)) = Y = b0+b1...
考试会让你求出Y,然后求p
Module 5 Time-Series Analysis
Trend models
linear
Log-linear
例题
Xyrees Taylor is an equity analyst evaluating the stock of Maclaurin Corporation. Taylor undertakes quantitative analysis to get a better understanding of how relevant valuation parameters have changed over time. First, Taylor examines the quarterly sales (in $ millions) of the company for the past six years (24 observations) to forecast sales for the current quarter. Taylor uses Model A, a log-linear model (ln yt = b0 + b1t + εt) where yt represents quarterly sales for quarter t. The regression estimates for the intercept and the trend coefficient are 5.74820 and 0.03795, respectively. Based on Model A, the predicted value of Maclaurin's sales for the current quarter is closest to: A. $326 millio B. $780 million C. $810 million
C is correct 解析: 之前已经过了24个季度,所以现在是第25个季度,t=25. Exp(5.74820+0.03795*25) = 810
【PS】要特别注意,这里的t不是1也不是24,而是25.
if serial correlation for error by DW test, use trend model
AR models
Assumption
Covariance stationary
Mean-reverting level
x = b0 / (1-b1)
例题
The end-of month WTI oil price was $51.16 in July 2015 and $42.86 in August 2015 (Month 181). Based on the mean-reverting level implied by the AR(1) model regression output in Exhibit 1, the forecasted oil price for September 2015 is most likely to be: A. less than $42.86. B. equal to $42.86. C. greater than $42.86.
C is correct. The mean-reverting level from the AR(1) model is calculated as xt = b0 / 1-b1 = 1.5948 / 1-0.9767 = $68.45. Therefore, the mean-reverting WTI oil price from the AR(1) model is $68.45. The forecasted oil price in September 2015 will likely be greater than $42.86 because the model predicts that the price will rise in the next period from the August 2015 price of $42.86.
均值回归公式很重要!
【解法1】套公式y=b0+b1 * x = 1.5948+0.9767*42.86=43.456162 > 42.86,选C。
【解法2】均值回归:Mean-reverting = b0 / (1-b1) = 1.5948/(1-0.9767)=68.446352 > 42.86,选C。
例题
After reviewing the time-series data, Martinez determines that the mean and variance of the time series of oil prices are not constant over time. She then runs the following four regressions using the WTI time-series data. Conclusion 1 The time series for WTI oil prices is covariance stationary. Martinez's Conclusion 1 is: A. correct. B. incorrect because the mean and variance of WTI oil prices are not constant over time. C. incorrect because the Durbin–Watson statistic of the AR(2) model is greater than 1.75.
B is correct. There are three requirements for a time series to be covariance stationary. First, the expected value of the time series must be constant and finite in all periods. Second, the variance of the time series must be constant and finite in all periods. Third, the covariance of the time series with itself for a fixed number of periods in the past or future must be constant and finite in all periods. Martinez concludes that the mean and variance of the time series of WTI oil prices are not constant over time. Therefore, the time series is not covariance stationary.
送分题
方差独立
协方差平稳
3个假设:均,方,协
Assumption violations
No autocorrelation (error)
Detection: t-stat
Correction: AR(1) ->AR(2)
例题
West Texas Intermediate (WTI) monthly crude oil price data, expressed in US dollars per barrel, for the 181-month period from August 2000 through August 2015. The end-of month WTI oil price was $51.16 in July 2015 and $42.86 in August 2015 (Month 181). Based on the data for the AR(1) model in Exhibits 1 and 2, Martinez can conclude that the: A. residuals are not serially correlated. B. autocorrelations do not differ significantly from zero. C. standard error for each of the autocorrelations is 0.0745.
C is correct. The standard error of the autocorrelations is calculated as 1/√T, where T represents the number of observations used in the regression. Therefore, the standard error for each of the autocorrelations is 1/√180 = 0.0745. Martinez can conclude that the residuals are serially correlated and are significantly different from zero because two of the four autocorrelations in Exhibit 2 have a t-statistic in absolute value that is greater than the critical value of 1.97. Choices A and B are incorrect because two of the four autocorrelations have a t-statistic in absolute value that is greater than the critical value of the t-statistic of 1.97.
Standard error = 1/ T^0.5
例题
John believes that the previous loan application will have an impact on the current application, so John uses model A, a first-order autoregressive model, AR(1). He determines that the coefficient of the first lag is significantly different from zero. He also calculates the autocorrelations of the residuals up to four lags and determines that only the residual autocorrelation at the second lag is significantly different from zero. Model A is most likely: A. correctly specified. B. misspecified based on the statistical results observed in the model's residuals. C. misspecified based on the coefficient of the first lag.
B is correct The AR(1) model is misspecified not because of the observed statistical result in the original time series, but because of the significant autocorrelation of residuals at lag second.
自相关没关系,可以加滞后性
残差有自相关有问题
例题
Based on the data for the AR(1) model in Exhibits 1 and 2, Exhibit 1:Crude Oil Price per Barrel, August 2000-August 2015 - | Linear | Log-Linear | AR(1) | AR(2) Observations | 181 | 181 | 180 | 179 Exhibit 2: Autocorrelations of the Residual from AR(1) Model Lag | Autocorrelation | t-Statistic 1 | 0.4157 | 5.5768 2 | 0.2388 | 3.2045 3 | 0.0336 | 0.4512 4 | -0.0426 | -0.5712 Note: At the 5% signifcance level, the critical value for a t-statistic is 1.97. Martinez can conclude that the: A. residuals are not serially correlated. B. autocorrelations do not differ significantly from zero. C. standard error for each of the autocorrelations is 0.0745.
C is correct 解析: A说没有自相关,B说相关系数不和0有显著区别,双重否定也就是等于0,也就是没有自相关。AB说的是同一个事情,所以选C。
【PS1】题目给t-stat是1.97,如果要证明没有自相关,需要所有都不不拒绝,也就是都<1.97。但是只有3和4是小于1.97,1和2不是,所以AB是错的。
【PS2】算标准差的公式是1/(T^0.5),因为是AR(1),所以在表1找到observation = 180,得到1/(180^0.5)=0.074536,所以C是对的。
例题
Olsen replies: "I can develop an AR model focusing on the growth rate of GDP, using the following three step method:" Step 1 Estimate a specific autoregressive model Step 2 Compute the correlations of the series with its own past values Step 3 Test to ensure that the autocorrelations differ significantly from 0 using the DurbinWatson statistic In organizing his three-step method to determine whether his AR model is correctly specified, Olsen is least likely correct about: A. Step 1. B. Step 2. C. Step 3.
答案:C 解析: C is correct. Step 3 is the incorrect step. The three step method to determine whether an autoregressive time-series model is correctly specified are: 1, estimate a particular autoregressive model; 2, compute the autocorrelations of the time series; and 3, test to see whether the residual autocorrelations differ significantly from 0. If the autocorrelations differ significantly from 0, the model is not correctly specified. Ensuring that the autocorrelations differ significantly from 0 confirms the model is not correctly specified and is an incorrect step.
No conditional heteroskedasticity (error)
Detection: ARCH(1)
Correction: generalized least squares
例题
Based on the results depicted in Exhibit 2, DeMolay and Kamini should most likely model the forward P/E data using a(n): A. generalized least squares model. B. AR(1) model. C. random walk model.
答案:A 解析:A is correct. If ARCH exists, the standard errors for the regression parameters will not be correct. In the case that ARCH exists, you will need to use generalized least squares or other methods that correct for heteroskedasticity to correctly estimate the standard error of the parameters in the time series model. B is incorrect because interpretation of any AR(1) result is problematic when ARCH exists. C is incorrect because the results in Exhibit 2 suggest that ARCH does exist in the data, so the time-series is not a random walk.
例题
From the data provided in Exhibit 2, for a 5% level of significance, Zhu can conclude that Duu's AR (1) model exhibits: A. no autoregressive conditional heteroskedasticity (ARCH(1)). B. serial correlation. C. multicollinearity.
正确答案:A 解析:该题主要考点为ARCH(1) error的判断。由表2信息可知,滞后一阶残差平方的系数的p值为0.32,大于0.05,所以该系数与0不存在显著的差异,从而该模型不存在自回归条件异方差。B和C选项为干扰项,因此,正确选项为A。
这里一定要注意,是b1不显著,说明没有ARCH
【PS1】p值直接和level of significance比较
【PS2】1阶serial correlation需要用Durbin-Watson (DW)测试,多阶需要用Breusch-Godfrey (BG)测试。Positive serial correlation导致type 1 error,反之type 2。解决方法:调整标准差。
【PS3】multicollinearity用variance inflation factor (VIF)测试,需要VIF>10。计算公式VIF = 1 / (1 - R^2)。导致type 2 error。解决方法:1. 拿走/更换自变量;2. 增加样本。
Covariance-stationary series (Xt)
violation: b1=1/unit root/random walk/non-stationary
simple random walk: x(t) = x(t-1) + error
random walk with drift: x(t) = B0 + x(t-1) + error
例题
John then conducts a Dickey–Fuller test for model A using the regression equation x(t) - x(t-1) = b0 + g1x(t-1) + εt. The results are shown in Exhibit 3. Based on Exhibit 3, the test that John conducts for the model A: A. is inconclusive. B. indicates that the model A is stationary. C. indicates that the model A exhibits a unit root.
B is correct Incorrect because the Dickey–Fuller test is based on the regression: x(t) - x(t-1) = b0 + g1x(t-1) + εt, E(εt) = 0. The null hypothesis of the Dickey–Fuller test is H0: g1 = 0—that is, that the time series has a unit root and is nonstationary—and the alternative hypothesis is Ha: g1 < 0, that the time series does not have a unit root and is stationary. As shown in Exhibit 3, the t-statistic is 10.542 and its p-value is 0.000, which is less than any conventional significance level, thus the null hypothesis that the coefficient is zero is rejected, which indicates that the model A is stationary.
注意这里假设是有单位根 -> p=0<a说明拒绝原假设,没有单位根 -> 平稳
例题
Kamini replies: "I'm convinced the P/E series based on trailing earnings truly is a random walk." If Kamini is correct regarding the trailing P/E time series, the best forecast of next period's trailing P/E is most likely to be the: A. current period's trailing P/E. B. forecast derived from applying the AR(1) model depicted in Exhibit 1 to the data. C. average P/E of the time series.
答案:A 解析:A is correct. If a time series is a random walk, the best forecast of that can be made in period t – 1 is −1. So, the best forecast of the next period's trailing P/E is the current period's trailing P/E. B is incorrect because random walks are not covariance stationary, so AR(1) models are not appropriate. C is incorrect because random walks have undefined mean-reverting levels. A mean-reverting process would allow for improved forecasts by incorporating the average value.
Random walk,后面都是前面加上误差
Detection: DF test
不检验b1=1,检验g1=(b1-1)=0,Ha: g1<0
例题
To study how the inflation affects the U.S. market, Zhu examines the U.S. quarterly inflation data over the past 20 years with an AR (1) model as well. Before using the AR (1) model to make predictions, Zhu wants to determine whether the time series of inflation data exhibits a unit root. Which of the following methods is most appropriate for Zhu to test unit root? A. t-test B. F-test C. Dickey-Fuller test
正确答案:C 解析:该题主要考点为单位根的检验。 Dickey-Fuller test用于检验时间序列数据是否存在单位根。因此,正确选项为C。
Unit root是协方差平稳的一部分,无脑选DF检验
例题
Sumner wants to investigate the relationship between UK house prices and the UK Consumer Price Index (CPI). To do so, she plans to regress the quarterly values of the HPI on a time series of quarterly values of the CPI for the same period. Before doing so, she performs the following preliminary statistical tests: Test 1: A Dickey–Fuller test on the times series of HPI; Test 2: A Dickey–Fuller test on the times series of CPI; Test 3: An (Engle–Granger) Dickey–Fuller test on the error term when regressing HPI on CPI. The results of regressing HPI on CPI are most likely valid if the null hypothesis is rejected in: A. Test 1 only. B. Test 2 only. C. Test 3 only.
C is correct A. Incorrect because, if we reject the hypothesis of a unit root for the dependent variable (HPI; Test 1) but fail to reject the hypothesis of a unit root for the independent variable (CPI; Test 2). The error term in the regression would not be covariance stationary, and we cannot use linear regression to analyze the relation between the two time series. B. Incorrect because, if we reject the hypothesis of a unit root for the independent variable (CPI; Test 2) but fail to reject the hypothesis of a unit root for the dependent variable (HPI; Test 1). The error term in the regression would not be covariance stationary. Consequently, the estimated regression coefficients and standard errors would be inconsistent. The regression coefficients might appear significant, but those results would be spurious. Thus we should not use linear regression to analyze the relation between the two time series in this scenario. C. Correct because the two time series will be cointegrated in this scenario, which means that the regression results are valid despite using two time series with a unit root. The null hypothesis of the Dickey–Fuller test is H0: g1 = 0—that is, that the time series has a unit root and is nonstationary—and the alternative hypothesis is Ha: g1 < 0, that the time series does not have a unit root and is stationary. Therefore, if the null hypotheses of the Dickey–Fuller test in Test 1 and Test 2 are not rejected, we must conclude that both time series have a unit root. In this case, we need to establish whether the two time series are cointegrated before we can rely on regression analysis. If the (Engle–Granger) Dickey–Fuller test rejects the null hypothesis that the error term has a unit root, then we may assume that the error term in the regression is covariance stationary and that the two time series are cointegrated. The parameters and standard errors from linear regression will be consistent.
首先要理解DF检验是代表有单位根,EG-DF检验是有单位根并且协方差不平整。 我们用回归分析的前提是,都没有单位根,或者都有单位根但是协方差平整。选项有个only,说明要拒绝1个,保留另外2个。A和B只要有任何1个保留,都代表有单位根,所以必须包装协方差平整(covariance co-integrated),所以我们需要拒绝C,并且和AB一起, 得到都有单位根并且协方差平整的结论。
这题不是直接问你covariance co-integrated的结论,而是用文字更加灵活的表述。
Correlation: first differencing
例题
If the time series exhibits a unit root, which of the following actions should Zhu take? A. Re-estimate the regression by using the natural log of the inflation data. B. Re-estimate the regression by adding a second lag variable. C. Re-estimate the regression by using the first difference of the time series.
正确答案:C 解析:该题主要考点为一阶差分(first differencing)。 对时间序列数据进行一阶差分处理是消除单位根的有效方法。因此,正确选项为C。
有unit test无脑上差分
例题
Sumner collects 10 years of quarterly data of a UK House Price Index (HPI, scaled to be 100 in the first quarter). After her initial analysis of the data, Sumner makes the following observations: Observation 1: Each consecutive value in the time series appears to increase by approximately the same positive amount, irrespective of the level of the index. Observation 2: A plot of the first-difference of the index shows roughly the same variance over time. Observations 1 and 2 most likely indicate that the first difference of the time series: A. has a unit root. B. is covariance stationary. C. is a random walk with drift.
B is correct A. Incorrect because the first difference of the HPI appears to be covariance stationary and so cannot have a unit root (since such time series are not covariance stationary). Specifically, Sumner's second observation, that the first difference of the HPI has roughly the same variance over time, indicates that the process is autoregressive and so does not have a unit root. B. Correct because we can often determine if a time series is covariance stationary by looking at a plot of the series. If the plot shows roughly the same mean and variance over time without any significant seasonality, then we may want to assume that the time series is covariance stationary. Sumner's first observation that the original time series has a linear trend indicates that the first-differenced time series will have a constant mean over time. This, coupled with Sumner's second observation that the variance is roughly the same over time, indicates that the first difference of the HPI is covariance stationary. C. Incorrect because the first difference of the HPI appears to be covariance stationary and so cannot have a unit root (since such time series are not covariance stationary). Specifically, Sumner's second observation, that the first difference of the HPI has roughly the same variance over time, indicates that the process is autoregressive and so does not have a unit root.
observation 1说x(t) - x(t-1)是恒定的,变成一阶差分的时候,相当于y(t)=x(t)-x(t-1),其中y(t)均值恒定。 obervation 2说y(t)的方差恒定。 由均值和方差都恒定,我们可以推断出协方差平稳的结论。
均值回归是E(xt)=b0/(1-b1),如果b1=1,不存在E(xt),有单位根,但是这里b1不等于1,因为协方差平稳。如果b1=1,b0=0,这个时候y(t)=error(t),这个是随机游走,这里也不满足。
随机游走是单位根的一种特殊形式。
Exception: unit root for x and y but co-integrated
例题
Zhu wonders if there exists certain relationship between the China aggregate retail sales and the U.S. inflation rates, and he plans to run a linear regression between them. However, he finds that both time series have a unit root after testing. Zhu can use linear regression to analyze the relationship between the two time series if: A. the two time series are cointegrated. B. the two time series are not cointegrated. C. the two time series are covariance stationary.
如果2个都有单位根,但是平整的话,也是可以用线性回归的
多元vs时间序列
自变量独立
多元:DW, BG
时间序列:t-test
用seasonal lag解决
同方差
多元:BP
时间序列:ARCH
用GLS解决
Comparing forecast model performance
In-sample forecast errors
Out-of-sample forecast errors
RMSE
Regressions with more than one time series
DF-EG test
M6 Machine Learning
Supervised machine learning
Penalized regression
LASSO
Support vector machine
K-nearest neighbor
Ensemble learning and random forest
Categories
different algorithms
same algorithm
different training data
Common algorithms
voting classifiers
Bootstrap aggregating
Random forest classifier
Disadvantage
black box
CART
Classification tree
例题
White then considers other machine learning algorithms and wants to choose one that meets the following requirements: ■Requirement 1: There is no need to specify an initial hyperparameter. However, regularization parameters can be added to avoid a potential overfitting problem; ■Requirement 2: The algorithm can provide a visual explanation and rationale for the prediction. Which of the following machine learning algorithms meets both of White's requirements? A. K-nearest neighbor B. Support vector machine C. Classification and regression tree
C is correct A.Incorrect because in a k-nearest neighbor algorithm, the number k, the hyperparameter of the model, must be chosen with the understanding that different values of k can lead to different conclusions. So, it does not meet the first requirement. In addition, a k-nearest neighbor algorithm does not provide a visual explanation and rationale for the prediction. B.Incorrect because a support vector machine algorithm does not provide a visual explanation and rationale for the prediction, which violates Requirement 2. A support vector machine algorithm does not need to specify an initial hyperparameter, but a cost parameter can be added as a penalty on the margin of the decision boundary. C.Correct because a classification and regression tree (CART) makes no assumptions about the characteristics of the training data, so if left unconstrained, it potentially can perfectly learn the training data. To avoid such overfitting, regularization parameters can be added. In addition, CART models are popular supervised machine learning models because the tree provides a visual explanation (and rationale) for the prediction. This contrasts favorably with other algorithms that are often considered to be 'black boxes' because it may be difficult to understand the reasoning behind their outcomes and thus to place trust in them.
KNN一开始要打标签,不符合 Support vector machine像个黑箱,不直观,也不符合 决策树一开始先分大类,然后一步步分小类,又不需要一开始打好标签,也比较直观
例题
Avery White is a financial analyst at SafeGrowth Investments (SGI), an asset management firm based in the US. The portfolio management team at SGI gives White a list of public firms that experienced financial distress and asks her to help with two tasks. The first task is to develop machine-learning based models to predict bankruptcy by grouping these firms into two categories: "bankrupt" or "not bankrupt". White first collects 25 fundamental and technical features of 800 firms that experienced financial distress, of which 100 filed bankruptcy in the last ten years. She then splits the 800 observations into three non-overlapping, homogeneous datasets with different purposes in mind. White's initial task requested by the management team is best described as a: A. clustering problem B. regression problem C. classification problem
C is correct A.Incorrect because clustering involves unsupervised machine learning with no target variable. White is asked by the management team to classify firms as "bankrupt" and "not bankrupt", which involves a binary target variable, thus it is a classification problem. B.Incorrect because a regression model is appropriate only when the target variable is continuous. White is asked by the management team to classify firms as "bankrupt" and "not bankrupt", which involves a binary target variable, thus it is a classification problem. C.Correct because white is asked by the management team to classify firms as "bankrupt" and "not bankrupt", which involves a binary target variable. "If the target variable is categorical or ordinal (e.g., determining a firm’s rating), then it is a classification problem.
clustering是非监督式,但是这里打了标记,是监督式,所以A不对。非监督式不打标签,只把相似的类聚在一起。 回归模型要求目标变量必须是连续的,这里也不符合。 C选项的分类问题是对的,这里在打标签分类。
Regression tree
例题
Litvenko later studies the model created by the computer. While he is generally satisfied with its fit, he is concerned that the large number of variables used may mean that he is "overfitting" his model, with some variables adding little to its explanatory power. He is also convinced that the relationships he is observing between the binary outcome and the explanatory variables are non-linear. He considers alternatives to his modeling approach to address these concerns The concerns Litvenko has with his machine learning model can best be addressed using which of the following alternative modeling approaches? A. CART approach B. Clustering algorithm C. Penalized regression technique
A is correct. The CART (classification and regression trees) approach is most commonly used when the outcome is binary (outperforms or does not) and there may be significant non-linear relationships among variables. Variables are added in order of the greatest contribution to misclassification error reduction and cease being added when there is no further meaningful reduction possible. B is incorrect. Clustering algorithms are a form of unsupervised learning that groups unlabeled data objects according to machine-identified patterns within the data, with no theory or predetermined relationships. C is incorrect. Penalized learning reduces the number of independent variables, but it assumes linear relationships.
处理overfitting,如果是supervised,可以用regression或者classification (SUM, JNN);如果是unsupervised,可以用dimension reduction或者clustering。 这里是supervised,所以clustering不合适。 并且是non-linear,所以regression不合适。 CART使用supervised,并且可以用来分类降维。
Prevent overfitting
Advantage
uncover complex dependencies
visual explanation
build expert systems
Unsupervised machine learning
Dimension reduction (RCA)
Principal component
例题
Finally, Johanson wants to determine whether there is any redundancy in the score data across the three pillars that might help reduce the dimensionality of the data. Johanson performs a principal component analysis (PCA) of the three individual ESG scores. The eigenvalues of each principal component (PC), along with the percentage of total variation across companies explained by each component, are presented in Exhibit 3. Johanson's goal is to select the principal components such that at least 85% of the total variation in the data is explained. To meet the stated goal of the PCA, Johanson should retain: A. PC1 only. B. PC1 and PC2 only. C. PC1, PC2, and PC3.
C is correct A. Incorrect because only 39.7% of the variation in the initial ESG data is explained if only the first principal component is retained. To explain more than 85% of the variation in the initial data, all three principal components are required. A candidate may select this answer choice since PC1 is the only principal component with an eigenvalue greater than 1. B. Incorrect because only 72% (= 39.7% + 32.3%) of the variation in the initial ESG data is explained if only the first and second principal components are retained. It is important to know how many principal components to retain because there is a trade-off between a lower-dimensional, more manageable view of a complex dataset when a few are selected and some loss of information. In practice, the smallest number of principal components that should be retained is that which the scree plot shows as explaining a desired proportion of total variance in the initial dataset (often 85% to 95%). Therefore, to explain more than 85% of the variation in the initial data, all three principal components are needed. C. Correct because only 72% (= 39.7% + 32.3%) of the variation in the initial ESG data is explained if only the first and second principal components are retained. Therefore, all three principal components are needed to explain more than 85% of the total variation in the data. In practice, the smallest number of principal components that should be retained is that which the scree plot shows as explaining a desired proportion of total variance in the initial dataset (often 85% to 95%). Here, if all three principal components are retained, this will explain 100% of the variation in the data, and there is little redundancy in the data.
主成分分析主要用来降维
我们要逐个加,直到满足我们解释的最低要求,这里要3个都加在一起才达到85%
Summarized highly correlated features
few main uncorrelated composite variables
Drawbacks
blackbox
Clustering
K-means clustering
Hierachical clustering
Agglomerative clustering
例题
Cambo is launching a new ETF. To minimize the trading and rebalancing costs, Cambo limits the number of stocks to be included in the ETF. He uses a machine learning algorithm to combine the stocks in the index into a number of groups based on the co-movement similarity of their returns. He then selects the five most liquid stocks from each group for inclusion in the ETF. Which of the following machine learning algorithms is most appropriate for Cambo to use when selecting the stocks for the new ETF? A. Agglomerative clustering B. Principal components analysis C. K-nearest neighbor
A is correct. Agglomerative clustering (or bottom-up hierarchical clustering) begins with each observation being treated as its own cluster. Then, the algorithm finds the two closest clusters, defined by some measure of distance (similarity), and combines them into one new larger cluster. This process is repeated iteratively until all observations are clumped into a single cluster. “Combine the stocks in the index into a number of groups” is a form of bottom-up approach, and classification is based on co-movement similarity of their returns, since how many classification results are unknow, it is a form of unsupervised learning, therefore, agglomerative clustering is the most appropriate choice. Principal components analysis (PCA) is an unsupervised ML algorithm that reduces highly correlated features into fewer uncorrelated composite variables. K-nearest neighbor (KNN) is a supervised learning technique most often used for classification. The idea is to classify a new observation by finding similarities (“nearness”) between it and its k-nearest neighbors in the existing dataset.
Principal components analysis (PCA)用来给含很多features的复杂模型做简化,找出重要的features
K-nearest neighbor要事先设定好K值
Agglomerative clustering不用事先确认分类数量,bottom-up
Deep learning
Network
Neutral network
Deep neural networks
Reinforcement learning
Generalization and overfitting
Overfitting
fit "too well"
too much complexity
Preventing overfitting
complexity reduction
K-fold cross-validation
Underfitting
not capture relationship
Generalization
generalized well beyond training data
retains explanatory power out-of-sample
Errors
High bias error and underfitting
High variance error and overfitting
例题
After training her first model, White discovers that the model can identify "bankrupt" and "not bankrupt" firms with low error in the training dataset, but does not perform well on the validation and test datasets. White's first model is most likely subject to: A. overfitting and bias error. B. underfitting and bias error. C. overfitting and variance error.
C is correct A.Incorrect because bias error refers to the degree to which a model fits the training data. White's first model performs well on the training data, which means the bias error is low. The model does have an overfitting problem because it performs well on the training data, but not on new data. B.Incorrect because White's first model is most likely being impaired by overfitting and variance error. Underfitting and high bias error occur when erroneous assumptions are used in training a model using the training dataset. White's first model performs well on the training data, but not on new data. This means that the model has an overfitting problem with low bias error. C.Correct because White's first model performs well on the training data, but not on new data, indicates an overfitting problem. Variance error refers to how much the model’s results change in response to new data from validation and test samples. Unstable models pick up noise and produce high variance, causing overfitting and high out-of-sample error.
这里要注意,bias error是样本内数据产生的误差,而variance error是样本外数据产生的误差
M7 Big Data Analysis
Data exploration
Structured data
Exploratory data analysis (EDA)
Feature selection
Feature engineering
Unstructure data
Exploratory data analysis (EDA)
Feature selection
TF, DF, TF-IDF
Chi-square test
Mutual information
Feature engineering
numbers
N-grams
Name entity recognition
Parts of Speech (POS)
Characteristics of big data (4v)
Volume
Variety
Velocity
Veracity
Model training
model selection
Performance evaluation
confusion matrix
Precision = TP / Prediction Positive = TP / (TP + FP)
Recall = TP / Real Positive = TP / (TP + FN)
Accuracy = True / Total = (TP + TN) / (TP + TN + FP + FN)
F1 = ( 2 * P * R) / (P + R)
例题
After running his model on the test set, Quinn produces a confusion matrix for evaluating the performance of the model (Exhibit 3). He reminds Wu that since the number of defaults in the dataset is likely much smaller than the number of non-defaults, this needs to be considered in evaluating model performance. Using Exhibit 3 and Quinn's reminder, the most appropriate measure of the accuracy of the model is: A. 0.79 B. 0.86 C. 0.92
B is correct Quinn reminds Wu that there are likely unequal class distributions in the dataset, making F1, the harmonic mean of precision and recall, a better measure of accuracy. Precision, P, measures what proportion of positive identifications were actually correct, where P = (TP)/(TP + FP), TP = True positives, and FP = False positives. P = (TP)/(TP + FP) = 118/(118 + 32) = 0.7866 = 0.79. Recall, R, measures what proportion of actual positives were identified correctly, where R = (TP)/(TP + FN) and FN = False negatives. R = (TP)/(TP + FN) = 118/(118 + 8) = 0.9365 = 0.94. F1 is the harmonic mean of precision and recall and is equal to (2 × P × R)/(P + R). F1 = (2 × P × R)/(P + R) = (2 × 0.79 × 0.94)/(0.79 + 0.94) = 0.86.
这题也有点不讲伍德。看似在问你accuracy,但是暗戳戳的提了下Quinn's reminder,背后的知识点是F1 score is more appropriate (than accuracy) when unequal class distribution is in the dataset. 所以这题其实在问F1
Receiver operating characteristics (ROC)
Root mean squared error (RMSE)
Tuning
dataset
例题
White first collects 25 fundamental and technical features of 800 firms that experienced financial distress, of which 100 filed bankruptcy in the last ten years. She then splits the 800 observations into three non-overlapping, homogeneous datasets with different purposes in mind: ■Dataset 1: Used to infer the pattern (or model) between the target and features. ■Dataset 2: Used to assess the fit of the model from Dataset 1 and tune the model hyperparameters if necessary. ■Dataset 3: Used to evaluate the accuracy of the final model. In the split of the 800 observations, Dataset 2 is best described as a: A. test dataset. B. training dataset. C. validation dataset.
C is correct A.Incorrect because the test dataset is used to provide an unbiased evaluation of the final model fit on the training dataset. To properly describe generalization and overfitting of an ML model, it is important to note the partitioning of the dataset to which the model will be applied. The dataset is typically divided into three non-overlapping samples: (1) training sample used to train the model, (2) validation sample for validating and tuning the model, and (3) test sample for testing the model’s ability to predict well on new data. B.Incorrect because the training dataset is used to train or infer the model between the target and the features. To properly describe generalization and overfitting of an ML model, it is important to note the partitioning of the dataset to which the model will be applied. The dataset is typically divided into three non-overlapping samples: (1) training sample used to train the model, (2) validation sample for validating and tuning the model, and (3) test sample for testing the model’s ability to predict well on new data. C.Correct because the validation dataset is used to evaluate the initial model obtained from the training dataset and tune the model parameters when necessary. To properly describe generalization and overfitting of an ML model, it is important to note the partitioning of the dataset to which the model will be applied. The dataset is typically divided into three non-overlapping samples: (1) training sample used to train the model, (2) validation sample for validating and tuning the model, and (3) test sample for testing the model’s ability to predict well on new data.
3个dataset分别是training, validation, test
Data preparation and wrangling
structured data
data preparation (cleansing)
Incompleteness error
Inaccuracy error
Non-uniformity error
例题
John Lin is an analyst of GFE Co., and he wants to build a model with structured financial data. Alex, the CEO of GFE Co. is meeting with John. Alex already uses some of John’s machine learning (ML) methods to better screen loan applicants. Exhibit 1 presents a small sample of the raw dataset before cleansing: What type of error appears to be present in the Exhibit 1? A. Invalidity error. B. Inconsistency error. C. Non-uniformity error.
C is correct Non-uniformity error occurs when the data are not presented in an identical format. In Exhibit 1, the data under the Date of Birth column is present in various formats. The data under the Salary column may also be non-uniform as the monetary units are ambiguous; the dollar symbol can represent US dollar, Canadian dollar, or others.
Invalidity: 超出有意义的范围。Age=-10; 吸烟(Y/N)=I like it
Inconsistency: 同一条重复记录,数值不同。
Non-uniformity: 格式不统一。
日期:2000-01-01 & 01/01/2000
金额:10万 & 3k
货币:USD 10 & EUR 10
Invalidity error
Inconsistency error
Duplication error
data wrangling (pre-processing)
Transformation
例题
After cleansing the data, Steele then preprocesses the dataset. She creates two new variables: an "Age" variable based on the firm's IPO date and an "Interest Coverage Ratio" variable equal to EBIT divided by interest expense. She also deletes the "IPO Date" variable from the dataset. What type of data transformation did Steele perform during the data preprocessing step? A. Extraction B. Conversion C. Aggregation
A is correct 解析: Steele根据IPO日期建立了"Age"变量,并且通过EBIT/利息费用来建立利息保障倍数变量,这个是属于extraction,它是指从现有变量中提取新变量以便于分析。
【PS1】Aggregation是将同类变量合一。如果不是同类,则是Extraction。举例:EBIT & interest -> interest coverage ratio 是extraction。Salary & Bonus -> total income是Aggregation。
【PS2】transformation的5个方法:1. extraction: EBIT & interest -> interest coverage ratio; 2. aggregation: salary & bonus -> total income; 3. filtration: delete data; 4. selection: delete variable/feature; 5. conversion: CAD -> USD;
Outlier
Scaling
Normalization
Standardization
unstructured data
Text cleansing
remove html tags
remove punctuations
remove numbers
例题
Wu tells Quinn that she has heard a little about text mining for clues about an individual's behavior and recalls that text preparation must be carried out by removing such items as HTML tags, punctuation, numbers, and stop words and eliminating the distinction between uppercase and lowercase words by lowercasing them all. Wu’s recollection about the preparation of the textual data is most accurate with respect to: A. numbers. B. stop words. C. lowercasing.
A is correct A.Correct. Punctuation, HTML tags, numbers, and white space are removed in the text preparation (or cleansing) stage. In the case of numbers, they should be replaced with an annotation, such as “/number/,” to indicate the presence of a number without being concerned about its actual value. Stop words and lowercasing are part of the text wrangling (preprocessing stage). B.Incorrect. Stop words are removed in the text wrangling (preprocessing) stage. C.Incorrect. Lowercasing is carried out in the text wrangling (preprocessing) stage.
这种题目,要是考试时候遇到,我只能说,这分送CFA了。
我建议理解每个处理方法,但是记忆具体什么操作是哪一步,看各人能力边界吧。
例题
Achler uses a web spidering program to obtain the data for the text-based model. Based on the source of the data, as part of the data cleansing and wrangling process, Achler most likely needs to remove: A. html tags and perform scaling. B. numbers and perform lemmatization. C. white spaces and perform winsorization.
B is correct 解析: ABC对data cleansing的操作都是正确的,但是AC对wrangling的操作是针对结构性数据,而模型是文本数据,所以应该选B。
【PS】结构数据的处理步骤: 1) conceptualization of the modeling task, 2) data collection, 3) data preparation and wrangling, 3.1 transformation: 1. extraction (出生日期->年龄); 2. aggregation (工资+奖金->年薪); 3. filtration (拿走行); 4. selection (拿走列); 5. conversion 3.2 outlier: detect (3 SD or 1.5 IQR); handle (trimming: 截尾; winsorization: refer to PS3) 3.2 Data scaling: refer to PS4 Pro 4) data exploration, and 5) model training.
【PS2】文本数据的处理步骤: 1) text cleansing: refer to XBOX 360 2) text wrangling, 2.1 Text normalization 2.2 Creation of bag-of-words, i.e. N-grams ("hot_dog") 2.3 Building document term matrix (DTM)
【PS3】winsorization: replaces extreme values and outliers with the maximum and minimum
【PS4】Text normalization Stemming(词干提取):convert inflected form of a word into its base word. Eg, convert "analysis" and "analyze" to "analyz". Lemmatization(词形还原):convert inflected forms of a word into its morphological root. E.g., convert "analyzed" and "analyzing" to "analyze". Remove stop words ("the", "is")
【PS4 Pro】Data scaling Normalization: Xnormalized = (X-Xmin)/(Xmax-Xmin) Standardization: Xstandardized = (X-u)/σ。Standardization是1级的知识点,可以记住这个,另一个就是Normalization
【PS5】收了可观的小费后,酒馆老板小声道:文本数据的处理方式很重要,优先级略高于结构数据的处理方式
【Xbox】结构化数据常见错误:1. incompleteness ("-","NA"); 2. invalidity (1900年出生); 3. inaccuracy ("dont know"); 4. inconsistency (Mr. xx & Female); 5. non-uniformity (2024/3/4, 5/4/2024); 6. duplication
【Xbox 360】text cleansing可以闭着眼睛拿走html tag和white space,但是最好不要直接拿走punctuation和number。应该用token来代替,比如/dollarsign/,/number/
【Xbox One】数据处理的知识点比较多,而且比较散,建议上面提到的每个名词,见到都能反应过来原理。最好自己做个思维导图把整体串起来
remove white spaces
Text wrangling (preprocessing)
Tokens and tokenization
Normalization
Bag-of-words (BOW)
Document term matrix (DTM)
特别提醒
所有内容纯自用,仅小范围分享给CFA学习打卡群成员,请勿进一步传播!
不卖课!不卖题!不卖学习资料!不卖任何东西!所有分享的学习资料纯免费分享,仅考友间互相学习交流使用,谢绝用于任何商业盈利用途!
的是重要知识点,颜色越深越重要
是习题,颜色越深越重要
该思维导图只用来努力覆盖70%基础知识点和常规考法,不覆盖任何拓展知识点和难题、进阶题。