导图社区 Raster Analysis
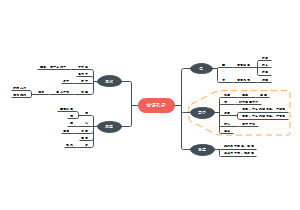
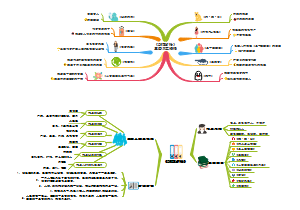
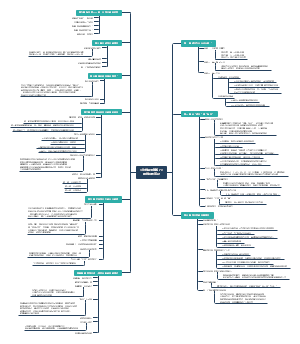
这是一篇关于Spatial Estimation and modelin的思维导图,主要内容包括:Correlation,Auto Correlation,Point pattern analysis,Hypothesis Testing。
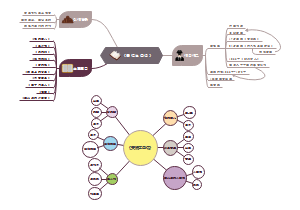
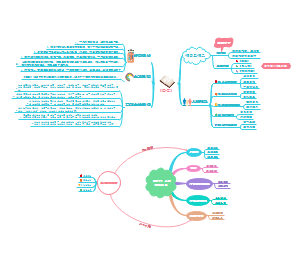
【世界的本质与规律:从物质到意识的辩证之旅】 世界统一于物质,运动是其根本属性,时空是物质存在的形式物质决定意识,而意识又能动地反作用于物质,指导实践、创造世界事物发展遵循量变到质变的规律,矛盾则是变化的动力斗争性推动转化,同一性维持稳定人脑作为特殊物质,孕育了自然界与历史共同塑造的意识辩证唯物主义以物质一元论为基础,克服了形而上学缺陷,既批判不可知论,又区别于唯心主义与二元论,实现了自然观与历史观的统一。
社区模板帮助中心,点此进入>>
论语孔子简单思维导图
《傅雷家书》思维导图
《童年》读书笔记
《茶馆》思维导图
《朝花夕拾》篇目思维导图
《昆虫记》思维导图
《安徒生童话》思维导图
《鲁滨逊漂流记》读书笔记
《这样读书就够了》读书笔记
妈妈必读:一张0-1岁孩子认知发展的精确时间表
Raster Analysis
Raster
in *gdb folder
.tiff, .tif ,.geotiff
Versus Vector Image
precison depeding on pixel
Quick Computation
Attribute Table (toolbox: Raster Attribute Table)
OBJECTID/OID
pixel id
VALUE
pixel value
COUNT
# of pixels with same value
Step 1: Set Raster Environment
Choose one raster layer (toolbox: Line/Point/Polygon to Raster)
set mask and snap Raster as the given raster layer
Step 2: Mapping Density (for point Vector Image)
Transfer csv to point vector image (toolbox: Display XY Data)
Using Density tool
Point Density
Kernel Density
Polulation Field: Give each point a "weight"
Step 3: Surface Analysis
Contours
Finding areas with same value
output is polyline (vector image)
Slope
degree of slope
arctan (rise/run)
percent of slope
100 * tan J
Aspect
Aspect from each cell of the surface
Hillshade
ViewShede
input: raster layer and observations points
output: new raster layer, value are visible/not visible
Cut&Fill
input: two Raster Layers
output: new Raster Layer, positive value means cut, negative value means Fill
Suitability Analysis
Step 1: Converting Data
toolsbox: feature to raster
density: Point density/ Kernel density
distance: Euclidean Distance...
surface analysis: slope, aspect, hillshade, viewshed, Cut/Fill
Step 2: Reclassify Data
Replace input cell value with new cell value
Group value or replace it based on new infomation
Rescale the value to the common Scale
Elimation method with NoData
Step 3: Weighted Combination
toolbox: Raster Calculator
Step 4: Raster Statistic
Cell Statistic: many rasters -> new raster image
Focal Statistic: like convolution
Zonal Statistic: Polygon + raster -> value
Spatial Estimation and modeling
Correlation
Positive
negative
Auto Correlation
Apatial Weights Matrix neihjbourhoods - lags
Contiguity
Nearestt neighbours
Distance
Testing
Moran's I
hypothesis
p < rhreshold
Moran's I > 0
clustering of similar value
Moran's I < 0
dispersion of similar value
otherwise
CSR
LISA
High-High, Low-Low
significant cluster
High-Low, Low-High
Outliers
Relulations
Everything is related to everythingelse,but near things are more related than distant things
Spatial Heterogeneity
Spatial Similarity principle
Point pattern analysis
Pattern: Centrography
Standard distance Circle
Mean center
standard distance
Standard deviational ellipse
major axis, minor axis, angle
nature of distribution: Spatial Clustering
Point Patterns
random
equal prob.
independence
number of events in any subregion follows Poisson distribution
uniform/dispersed
clustered
Statistics: Average Nearest Neighbour
D_o : observe mean distance
D_E: expected mean distance
do z-score of D_O and D_E can get p-value
ANN > 1
Dispersed
ANN » 1
Random
ANN < 1
Clustered
H0
compete CSR
H1
deviate from CSR
Hypothesis Testing
null hypothesis is prediction of no relationship
Comparison of within-group var or between-group var
Test we choose
continuous-continuous
Peasonr
continuous-bivariate categorical
t-test
continuous-multivariate categorical
Anova
categorical-categorical
Chi-square test
returns
estimate of difference
p-value
smaller than threshold
reject null hypothesis
can not reject