导图社区 
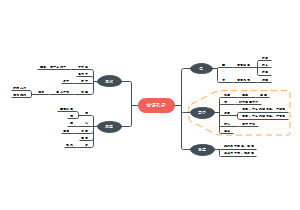
exploring and collection data basics
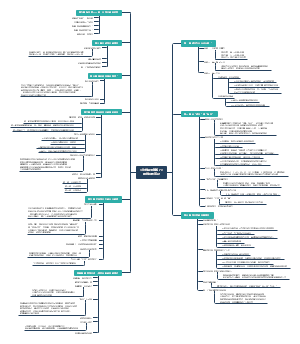
10 basic knowledge for business statistic including differences between population and sample, probability versus statistic....
编辑于2022-06-15 05:51:4510 basic knowledge
I. population and sample
population
definition: set of all items of interst
symbol: population size: N
example:all of uoft students
parameter
defintion: number descriping a population
symbol: population mean= μ
sample
defintion: subset of population
symbol: statistic size: n
example: random sampling 1000 uoft students
statistic
defintion: number descriping a sample
symbol: sample mean:¯x¯
II. statistic
descriptive statistic
describe a sample
inferential statistics
definition: make inference about a population and its parameter using sample data
III. probability versus statistic
probability
know everything, know population
calculate probability of an event occurs
statistic
unknown population
take sample dataand calculate sample statistic
infer parameter
IV. sampling and nonsampling error
Sampling Error
characteristics
it is not a mistake
cause the sample is a random subset of the population
as sample size rizes, sampling error tends to fall
Non-sampling Error
4 categories
biased estimate
definition: systematically higher or lower than the population parameter
reason: sample is too samll
systematic lying
reason: due to poor survey design
example: There is a survey about humanity and some passerbys could give money to homeless dogs under moral pressure if lots of people arrounded him.
non-response bias
reason: low response rate where non-responders differ from responders
example: If students can write report letter to the headmaster email which decide whether teachers leave or stay, it could appear a situation that letters are almost bad letters to teachers.
sampling frame differs from target population
reason: the list from which units are drawn for the sample is wrong.
example: if a investiagator plan to make a survey of meansalary of uoft students, but he asks parents of uoft students. (cause students could lie to their parents.)
V. What are data
definition: data are recorded information, whether numbers of labels together with its context
3 types
cross sectional data
definition: same variables in same time period measured for different units
time series data
definition: same variables for same unit measured a different time period
panel
definition: same variables measured for a range of units and time periods.
VI. What is variable
definition: A variable holds information about the data.
Quantitative variable数字变量
definition: a variable in which the numbers are values of measured quantities
Discrete variable
definition: a finite or countable list of values 结果有限
example: number of heads in 4 tosses of a coin
continuous variable
definition: any value possible in an interval(uncountable)结果无限
example: after tax income
categorical variable类别变量
defiinition: a variable that labels the category of the measured unit
discrete variable only
4 types
Quantitative variable
Interval
numerical measurements which allow for degree of difference between values
distance is consistent but ratios are meaningless
Does not have a true 0 measure
Ex: dates
Ratio
numerical measurements which allow for degree of difference between values
ratios are meaningful-sensible to carry out multiplication/division
Ex: temperature, length,time duration
Categorical variable
Nominal
categorize units into distinct classes
unordered categories
Ex: gender, program of study, favorite color
Ordinal
ordered categories without natural units / distance metric.
natural ordering to the categories; not just the names of the categories differ
Ex: letter grades, income, professional rank
VII. Frequency tabulation
definition: Lists all unique values in data & relative frequency
Interval or nominal data
VIII. Bar chart vs. Histogram
Bar chart: used for limited outcomes
Ex:head or tail
discrete
Histogram: used for unlimited outcomes
Ex: 10,000 people after tax income and outcome is unlimited
IX. Cross Tablution
= contigency table = two-way table
measures frequency that two variables take each possible pair of values (freq tab: one variable)
X. Simpson's paradox/ Composition effect
same data look alone is diiferent to overall
solution: do more experiences.
believe ability, choose b
believe luck, choose a
Two cross-tabs
70: 70 female watch 129 powerad
17: 17 female remember powerad
43: 43 people remember powerad
Ex
165: 254 total, 164 attendences forgot
64.96: 64.96% attendences forgot
254: total 254 attendances
123: 123 attendences are male
48.43:48.83% attendences are male
254: total 254 ads
129: 254 total, 129 power ads
50.79: 50.79% power ads
A company wanted to know whether its ads would be remembered by customers. Then, they found some attendences who donot know the test context to do a quiz. Investigators let these units to watch TVs about 2 hours and released a car ad. some audience would watch the horsepower ad, and some other people would watch the safety ad. After they finished TV, investigators would ask them whether remember some details of ads
Goal: compare ads "Power": emphasizes horsepower "Safety": emphasizes safety features Participants watch TV alone for 2 hours. Insert one ad at random with other ads. Give "quiz" about car
Histogram
Bar Chart
Bat Chart to summarize tabulation
NSSE 2006, U of T seniors: if you could start again, would you go to the same instituition you are now attending? 1=definitely yes 2= probably yes 3= probably no 4= definitely no
tables meaning: a variable, the number of occurrences of different outcomes.
992 tosses, 286 for 1
992 tosses, 28.3% for 1
68.15 means the probability of occurrences of 1 and 2
# of variables: 2
I. exclude sequence
# of observations: 3
# of units
categorical
nominal
unordered
ordinal
ordered
quantitative
interval
discrete
ratio
continuous
Q:
Q1: Consider data on 257 people who tasted a new snack product at loblaws. Each was asked: how likely is it that you will purchase this product in the future? which kind of data are these: a. Cross sectional data b. Time series c. Panel data
answer: a
Q2: Price of the textbook each year for the past decade and the percent of students that had a copy. which kind of data are these? a. Cross sectional data b. Time series c. Panel data
answer: b