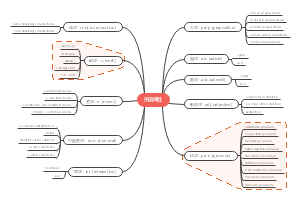
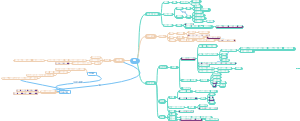
导图社区 Arthas常用命令与技巧总结
Arthas常用命令与技巧总结
Arthas 是一款线上监控诊断产品,通过全局视角实时查看应用 load、内存、gc、线程的状态信息,并能在不修改应用代码的情况下,对业务问题进行诊断,包括查看方法调用的出入参、异常,监测方法执行耗时,类加载信息等,大大提升线上问题排查效率。
编辑于2022-09-08 08:59:47 浙江省- JVM
- 高中人教版生物选择性必修3
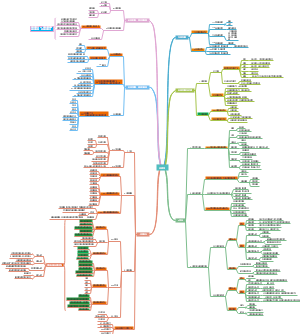
这是一篇关于高中人教版生物选择性必修3的思维导图,将高中人教版生物选择性必修3的复杂知识进行了有条不紊的整合与梳理。从基因工程这一前沿且重要的领域,详细涵盖了基因工程的基本工具、操作程序以及应用等多方面内容,像基因工程工具酶的特点、操作步骤中的核心要点等都一一呈现。细胞工程部分,植物细胞工程和动物细胞工程的各项技术,如植物组织培养、动物细胞培养等的原理、步骤和应用,在模板中都有着清晰的展示。发酵工程则深入讲解了传统发酵技术和现代发酵工程的相关知识,包括各种发酵产品的生产流程和原理。而生物技术的安全性与伦理问题,也从转基因产品的安全性、生殖性克隆人等多个角度进行了剖析,帮助学生全面理解这一热点话题。对于即将参加高考的学生来说,这份模板具有极高的实用价值。它能够帮助学生快速构建完整的知识体系,将零散的知识点串联起来,加深对知识的理解和记忆。在复习过程中,学生可以根据模板快速定位重点和难点知识,有针对性地进行学习和巩固。无论是用于日常的知识复习,还是考前的冲刺总结,都能显著提高学习效率,让学生更加从容地应对高考生物的挑战。
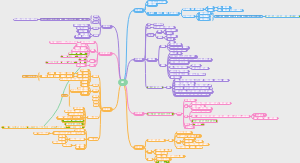
- 高考英语高频 500 词
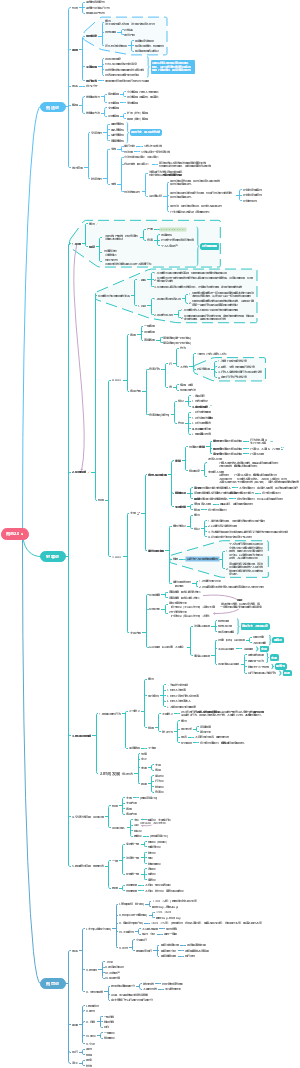
该思维导图将高考英语高频词汇进行了科学分类,涵盖高频形容词、高频介词&代词、高频副词&连接词等多个类别,同时右侧还细分出作文必背高频词、阅读必认动词、阅读高频名词等,分类细致入微,方便考生根据不同题型和需求进行针对性学习。对于每一个分类下的高频词汇,都配有详细的释义,这有助于考生准确理解词汇的含义和用法。高频形容词能帮助考生在写作和阅读中更生动、准确地表达和理解;介词和代词虽小,却在句子结构和语义理解中起着关键作用;副词和连接词则能让考生的表达更流畅、逻辑更清晰。作文必背高频词为考生撰写优秀作文提供词汇储备,阅读必认动词和高频名词能帮助考生在阅读中快速理解文意,提高答题效率。对于高考生来说,这是提升英语成绩的得力助手。在备考时间紧张的情况下,通过这张思维导图,考生可以快速抓住重点词汇,进行高效记忆和复习。教师可以将其作为教学参考资料,帮助学生更好地梳理和掌握高频词汇。英语基础较为薄弱,想要在短时间内提升词汇量的学生,也能借助此图实现词汇量的快速扩充。无论是日常学习、考前冲刺,还是查漏补缺,这张思维导图都能满足需求,助力考生在高考英语中取得理想成绩。
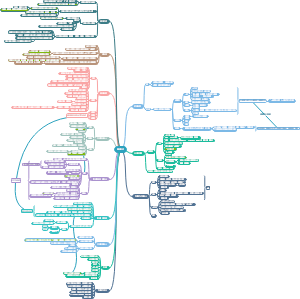
- 正则表达式
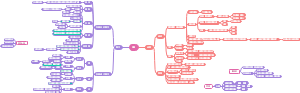
正则表达式:文本处理的万能钥匙!一、基础概念:用模式描述字符串规则,掌握元字符、量词、分组即可入门二、核心语法:从简单匹配到复杂逻辑,精准控制文本三、高级特性:零宽断言等技巧解决棘手问题,注意不同语言引擎差异四、应用场景:格式验证、日志分析、批量替换,覆盖编程语言(Python/Java)、编辑器(VS Code)、数据库(MySQL)等附赠工具:regex101在线调试,regexr可视化学习,助你快速上手!
Arthas常用命令与技巧总结
社区模板帮助中心,点此进入>>
- 高中人教版生物选择性必修3
这是一篇关于高中人教版生物选择性必修3的思维导图,将高中人教版生物选择性必修3的复杂知识进行了有条不紊的整合与梳理。从基因工程这一前沿且重要的领域,详细涵盖了基因工程的基本工具、操作程序以及应用等多方面内容,像基因工程工具酶的特点、操作步骤中的核心要点等都一一呈现。细胞工程部分,植物细胞工程和动物细胞工程的各项技术,如植物组织培养、动物细胞培养等的原理、步骤和应用,在模板中都有着清晰的展示。发酵工程则深入讲解了传统发酵技术和现代发酵工程的相关知识,包括各种发酵产品的生产流程和原理。而生物技术的安全性与伦理问题,也从转基因产品的安全性、生殖性克隆人等多个角度进行了剖析,帮助学生全面理解这一热点话题。对于即将参加高考的学生来说,这份模板具有极高的实用价值。它能够帮助学生快速构建完整的知识体系,将零散的知识点串联起来,加深对知识的理解和记忆。在复习过程中,学生可以根据模板快速定位重点和难点知识,有针对性地进行学习和巩固。无论是用于日常的知识复习,还是考前的冲刺总结,都能显著提高学习效率,让学生更加从容地应对高考生物的挑战。
- 高考英语高频 500 词
该思维导图将高考英语高频词汇进行了科学分类,涵盖高频形容词、高频介词&代词、高频副词&连接词等多个类别,同时右侧还细分出作文必背高频词、阅读必认动词、阅读高频名词等,分类细致入微,方便考生根据不同题型和需求进行针对性学习。对于每一个分类下的高频词汇,都配有详细的释义,这有助于考生准确理解词汇的含义和用法。高频形容词能帮助考生在写作和阅读中更生动、准确地表达和理解;介词和代词虽小,却在句子结构和语义理解中起着关键作用;副词和连接词则能让考生的表达更流畅、逻辑更清晰。作文必背高频词为考生撰写优秀作文提供词汇储备,阅读必认动词和高频名词能帮助考生在阅读中快速理解文意,提高答题效率。对于高考生来说,这是提升英语成绩的得力助手。在备考时间紧张的情况下,通过这张思维导图,考生可以快速抓住重点词汇,进行高效记忆和复习。教师可以将其作为教学参考资料,帮助学生更好地梳理和掌握高频词汇。英语基础较为薄弱,想要在短时间内提升词汇量的学生,也能借助此图实现词汇量的快速扩充。无论是日常学习、考前冲刺,还是查漏补缺,这张思维导图都能满足需求,助力考生在高考英语中取得理想成绩。
- 正则表达式
正则表达式:文本处理的万能钥匙!一、基础概念:用模式描述字符串规则,掌握元字符、量词、分组即可入门二、核心语法:从简单匹配到复杂逻辑,精准控制文本三、高级特性:零宽断言等技巧解决棘手问题,注意不同语言引擎差异四、应用场景:格式验证、日志分析、批量替换,覆盖编程语言(Python/Java)、编辑器(VS Code)、数据库(MySQL)等附赠工具:regex101在线调试,regexr可视化学习,助你快速上手!
- 相似推荐
- 大纲