导图社区 3 Financial Statement Analysis
- 96
- 0
- 1
- 举报
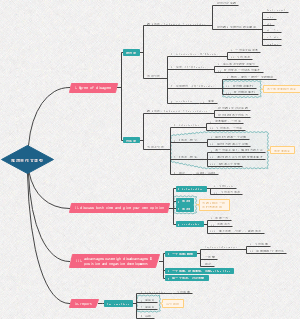
3 Financial Statement Analysis
2023年最新考纲CFA二级财报科目,部分内容与一级重合,其中Financial statement modeling从Equity valuation中抽出
编辑于2023-05-18 11:39:14 上海- 2024cpa会计科目第17章收入、费用和利润
2024cpa会计科目第17章,本章属于非常重要的章节,其内容知识点多、综合性强,可以各种题型进行考核。既可以单独进行考核客观题和主观题,也可以与前期差错更正、资产负债表日后事项等内容相结合在主观题中进行考核。2018年、2020年、2021年、2022年均在主观题中进行考核,近几年平均分值 11分左右。
- 2024cpa会计科目第十二章或有事项
2024cpa会计科目第十二章,本章内容可以各种题型进行考核。客观题主要考核或有资产和或有负债的相关概念、亏损合同的处理原则、预计负债最佳估计数的确定、与产品质量保证相关的预计负债的确认、与重组有关的直接支出的判断等;同时,本章内容(如:未决诉讼)可与资产负债表日后事项、差错更正等内容相结合、产品质量保证与收入相结合在主观题中进行考核。近几年考试平均分值为2分左右。
- 2024cpa会计科目第十一章借款费用
2024cpa会计科目第十一章,本章属于比较重要的章节,考试时多以单选题和多选题等客观题形式进行考核,也可以与应付债券(包括可转换公司债券)、外币业务等相关知识结合在主观题中进行考核。重点掌握借款费用的范围、资本化的条件及借款费用资本化金额的计量,近几年考试分值为3分左右。
3 Financial Statement Analysis
社区模板帮助中心,点此进入>>
- 2024cpa会计科目第17章收入、费用和利润
2024cpa会计科目第17章,本章属于非常重要的章节,其内容知识点多、综合性强,可以各种题型进行考核。既可以单独进行考核客观题和主观题,也可以与前期差错更正、资产负债表日后事项等内容相结合在主观题中进行考核。2018年、2020年、2021年、2022年均在主观题中进行考核,近几年平均分值 11分左右。
- 2024cpa会计科目第十二章或有事项
2024cpa会计科目第十二章,本章内容可以各种题型进行考核。客观题主要考核或有资产和或有负债的相关概念、亏损合同的处理原则、预计负债最佳估计数的确定、与产品质量保证相关的预计负债的确认、与重组有关的直接支出的判断等;同时,本章内容(如:未决诉讼)可与资产负债表日后事项、差错更正等内容相结合、产品质量保证与收入相结合在主观题中进行考核。近几年考试平均分值为2分左右。
- 2024cpa会计科目第十一章借款费用
2024cpa会计科目第十一章,本章属于比较重要的章节,考试时多以单选题和多选题等客观题形式进行考核,也可以与应付债券(包括可转换公司债券)、外币业务等相关知识结合在主观题中进行考核。重点掌握借款费用的范围、资本化的条件及借款费用资本化金额的计量,近几年考试分值为3分左右。
- 相似推荐
- 大纲


Financial Statement Analysis
Intercorporate Investments
Overview
Financial assets(<20%): IFRS 9
The relationship between coupon rate and YTM
IFRS 9
Classification of Financial Assets
Impairment
The new standard moves the recognition criteria from an "incurred loss" model to an "expected loss" model
Reclassification
Equity instruments: not permitted
Debt instruments: is only permitted if the business model for the financial assets (objective for holding the financial assets) has changed in a way that significantly affects operations
AMC → FVPL: fair value with any gain or loss immediately recognized in profit or loss
FVPL → AMC: fair value at the reclassification date becomes the carrying amount
Associate(20%-50%)
特点
20% to 50% of the voting rights of an associate
Less than 20% but have significant influence
Equity method
The equity investment is initially recorded on the investor's balance sheet at cost
The carrying amount of the investment is adjusted to recognize the investor's proportionate share of the investee's earnings or losses and are reported in income
Dividends or other distributions received from the investee: return of capital
reduce the carrying amount of the investment
not reported in the investor's profit or loss
公式
Income Statement: A gain is recognized = current year’s net profit of the investee *percentage of interest owned
Balance sheet: The carrying amount of investment = cost of investment + (accumulated net profit of the investee –accumulated dividends declared by the investee) * percentage of interest owned
Losses from Associates
If the investment value is reduced to zero ,the investor usually discontinues the equity method and does not record further losses
If the investee subsequently reports profits, the equity method is resumed after the investor’s share of the profit equals the share of losses not recognized during the suspension of the equity method
Purchase price
Excess of Purchase Price Over Book Value Acquired
长期股权投资的初始投资成本大于取得投资时应享有被投资单位可辨认净资产公允价值份额的,两者之间的差额不要求对长期股权投资的初始投资成本进行调整
长期股权投资的初始投资成本小于取得投资时应享有被投资单位可辨认净资产公允价值份额的,两者之间的差额应计入取得投资当期的营业外收入,同时调整增加长期股权投资的账面价值
Amortization of Excess Purchase Price
The investor must directly record these adjustment effects by reducing the carrying amount of the investment on its balance sheet and by reducing the investee's profit recognized on its income statement
Transactions
方式
Upstream sale: the profit on the intercompany transaction is recorded on the associate's income (profit or loss) statement
Downstream sale: the profit is recorded on the investor's income statement
The investor company's share of any unrealized profit must be deferred by reducing the amount recorded under the equity method
Both IFRS and US GAAP require that the unearned profits be eliminated
Impairment
IFRS
The test of the entire carrying amount of investment is by comparing its recoverable amount with its carrying amount
确认
The impairment loss: on the income statement
The carrying amount
Reduce directly
Allowance account
US GAAP
The decline of fair value below its carrying value is permanent
An impairment loss is recognized on the income statement and the carrying value of the investment on the balance sheet is reduced to its fair value
Both IFRS and US GAAP prohibit the reversal of impairment losses
Fair value option
The election to use the fair value option occur at the time of initial recognition and is irrevocable
Subsequent to initial recognition, the investment is reported at fair value with
Unrealized gains and losses arising from changes in fair value
Interest and dividends received included in the investor's profit or loss (income)
是否有选择权
US GAAP: available to all entities
IFRS: restricted to venture capital organizations, mutual funds, unit trusts, and similar entities, including investmentlinked insurance funds
Joint ventures(50%)
Equity method: Both IFRS and US GAAP require this method
Proportionate consolidation: Only under rare circumstances will joint ventures be allowed to use this. The venturer's share of the assets, liabilities, income, and expenses of the joint venture to be combined or shown on a line-by-line basis
Combination(>50%)
Acquisition Method
Business Combinations
Merger (吸收合并) • Company A+ Company B = Company A
Acquisition (控股合并): Company A+ Company B = (Company A + Company B)
Consolidation (新设合并): Company A+ Company B = Company C
合并报表编制的基本流程
Balance sheet
基于公允价值调整子公司个别资产负债表
母公司的账面价值与子公司全部的公允价值逐项相加,合并报表层面确认“少数股东权益”(<100%)
将母公司长期股权投资的账面价值与子公司所有者权益的公允价值抵消,合并报表层面确认“商誉"(若有)
Income statement
自购买日起,将子公司全部的收入、成本费用逐项与母公司相加
对于母公司与子公司、子公司相互之间发生的经济业务,视同一会计主体内部业务处理,全额抵消;调整子公司公允价值与账面价值差额的摊销额
在“企业合并净利润”中,扣除“少数股东损益”,计算得出“归属于母公司净利润”
Goodwill
Partial(IFRS, US GAAP)
goodwill = Purchase Price − X% × FV of subsidiary's NIA
minority interest = (1-X%) × FV of subsidiary's NIA
Full (IFRS)
goodwill = (Purchase Price /X%) − FV of subsidiary's NIA = (Partial)goodwill /X%
minority interest =(1 − X%) × (Assumed 100% Purchase Price ) =(1 − X%) × (Purchase Price /X%)
Goodwill impairment
IFRS
企业合并所形成的商誉,至少应当在每年年终进行减值测试
对于因企业合并形成的商誉的账面价值,应当自购买日起按照合理的方法分摊至相关的资产组;商誉应当结合与其相关的资产组或者资产组组合进行测试
比较这些相关资产组或者资产组组合的账面价值(包括所分摊的商誉的账面价值部分)与其可收回金额,如相关资产组或者资产组组合的可收回金额低于其账面价值的,应当就其差额确认减值损失
减值损失金额应当首先抵减分摊至资产组或者资产组组合中商誉的账面价值;再根据资产组或者资产组组合中除商誉之外的其他各项资产的账面价值所占比重按比例抵减其他各项资产的账面价值
US GAAP (two-step approach)
Compare the carrying amount of the reporting unit (including goodwill) to its fair value. If the carrying value of the reporting unit exceeds its fair value, potential impairment has been identified
Measure the amount of the impairment loss: The amount is the difference between the implied fair value of the reporting unit's goodwill and its carrying amount
SPE and VIE
SPE (Special purpose entities) can be a legitimate financing mechanism for a company to segregate certain activities and thereby reduce risk; consolidated on financial statements
VIE(variable interest entity): An entity that is financially controlled by one or more parties that do not hold a majority voting interest
Effect of methods
Other issues
Contingent Consideration
Contingent consideration may be negotiated as part of the acquisition price. For example, the acquiring company (parent) may agree to pay additional money to the acquiree's (subsidiary's) former shareholders if certain agreed upon events occur
会计处理 (IFRS and US GAAP)
Initially: measured at fair value
In subsequent periods
Changes in the fair value of liabilities: recognized in the consolidated income statement
Do not remeasure equity classified contingent consideration
Contingent Assets and Liability
In-Process R&D
Initial:as a separate intangible asset and measure it at fair value (if it can be measured reliably)
In subsequent periods
Amortization if successfully completed (a marketable product results)
Impairment if no product results or if the product is not technically and/or financially viable
Restructuring Costs: Do not recognize restructuring costs that are associated with the business combination as part of the cost of the acquisition. Instead, they are recognized as an expense in the periods the restructuring costs are incurred
Employee Compensation: Post-Employment and Share-Based
Overview
Measuring DB
PBO: the actuarial present value of all future pension benefits earned to date, based on expected future salary increases
Estimated annual payment after retirement = estimated final salary *benefit formula * estimated years of service
过程
Actuarial Assumptions to Estimate PBO
Future compensation increase and levels: salary growth rate, length of service, employee turnover
Life expectancy for post-employment
Expected vesting: If the employee leaves the company before meeting the vesting criteria, he may be entitled to none or a portion of the benefits earned up until that point
Discount rate is the interest rate used to calculate the present value of future benefits
Pension obligation (PBO)
Current service cost
Definition: the amount by which a company's pension obligation increases as a result of employees' service in the current period
Projected unit credit method: Annual unit credit = value at retirement date / years of service
Presentation of financial statements
Balance sheet presentation
Funded status (required by both IFRS and US GAAP) = Fair value of plan assets – PBO
Offset disclosure (net reporting)
Plan assets (PA)>PBO: overfunded; net assets
PA<PBO(FS<0): underfunded; net liabilities
Asset ceiling: When a company has a surplus in a defined benefit plan, the amount of reported asset cannot be larger than this level
计算
Plan Assets
Fair value at the beginning of the year +Contributions+Actual return-Benefits paid =Fair value at the end of the year
PBO
PBO at the beginning of the year +Service cost+Interest cost+Past service cost (+/- )Actuarial losses/gains Benefits paid =PBO at the end of the year
Income statement presentation
Periodic Pension Cost (PPC)
IFRS
Reported in P&L
Current service cost
Past service cost
Interest expense (PBO*r)
Interest income (PA*r)
Reported in OCI
Actuarial gains and losses
Actual return on plan assets -the amount included in the net interest expense/income calculation
概要
US GAAP
Reported in P&L
Current service cost
Interest expense (PBO*r)
Expected return on plan asset (PA*re)
The amortization of past service costs: over the remaining service life of the affected employees
The amortization of actuarial gains and losses (Corridor approach)
max (the beginning PBO, plan assets)*10%
The excess amount over the "corridor" is amortized as a component of periodic pension cost in P&L
Reported in OCI
Unamortized of the past service costs
Unamortized of the actuarial gains and losses
Changes in assumptions (retirement age, mortality) result in gains or losses in PBO
expected return - the actual return on plan assets
概要
Total Periodic Pension Cost (TPPC)
TPPC = PPC in I/S + PPC in OCI
TPPC = employer contributions − (ending funded status − beginning funded status) (考试常用)
Impact of assumptions
If the discount rate increases
PBO ↓
Current service cost ↓
Interest expenses =PBO*r
Int ↓, if the employee is young
Int ↑, if the plan is mature
Pension costs in I/S ↓
Funded status ↑
Plan asset no effect
TPPC ↓
If compensation growth rate decreases
PBO ↓
Current service cost ↓
Interest expenses ↓
Pension costs in I/S ↓
Plan asset no effect
Funded status ↑
TPPC ↓
If expected return on assets increases
Pension costs in I/S ↓
Others: no effect
Other post employment benefits (OPB)
作用
Used to substitute the compensation growth rate
Inflation will decrease gradually and become constant to ultimate healthcare trend rate
Holding all else equal, each of the following assumptions would result in a lower benefit obligation and a lower periodic cost
A lower assumed near-term increase in health care costs
A lower assumed ultimate health care cost trend rate
An earlier year in which the ultimate health care cost trend rate is assumed to be reached
Disclosures
Periodic Pension Cost
IFRS: the components can be included in various line items
US GAAP
The entire periodic pension cost in P&L (including interest) is shown as an operating expense
Analysts adjust GAAP-reported income
+
the periodic pension cost in P&L
Interest cost → interest expense
Actual return on plan assets → nonoperating income
- only service cost in determining operating income
Cash Flow
Over contribution (repayment): contribution > total periodic pension costs
CFO +(Contribution - TPPC)*(1-t),
CFF - (Contribution - TPPC)*(1-t)
Under contribution (borrowing): contribution < total periodic pension costs
CFO -(Contribution - TPPC)*(1-t),
CFF + (Contribution - TPPC)*(1-t)
Total cash flow: remain constant
Share-based compensation
Equity settled
Stock options
一些概念
Grant date: the date that the compensation approved
Service period: the period between grant date and vesting date
Vesting date: the date that employees can first exercise the stock option
Exercise date: employees receive the stocks
Stock grants
特点: Based on market value of the stock on the grant date
Types
Stock without conditions
Restricted stock
Performance stock
Weakness
The receivers have limited influence over the companys market value(market declines)
Lead managers to be risk averse or excess risk seeking
May dilute the shareholders' interests
Cash settled
Stock appreciation rights
Employees have the right to receive the profit of price increase at a predetermined quantity
Have limited downside risk, a right not obligation, however, require an cash outlay now
Phantom stock
特点
Based on the performance of hypothetical stock
Suitable for illiquid stock or privately held firm
Strengths: No shares are issued, no dilution to existing shareholders
Multinational Operations
Foreign currency transactions
使用情况
Makes an import purchase or export sale.
Borrows or lends funds where the amount to be repaid or received is dominated in a foreign currency
计算
Settlement before balance sheet date
Settlement intervening balance sheet date
Transaction gain or loss →I/S→RE
Gain or loss
Translation of foreign currency FS
Analytical Issues and Disclosure
The two most common treatments
other operating income/expense
non-operating income/expense
Disclosure of the line item
IFRS: amount of exchange rate differences recognized in profit or loss
U.S.GAAP: the aggregate transaction gain or loss included in determining net income for the period
Currency
Presentation currency: (reporting currency) the currency in which financial statement amounts are presented
Functional currency: the currency of the primary economic environment in which an entity operates
Local currency: the currency where the company operates
定义: translate the entity's financial statements to presentation currency (reporting currency)
Translation
选择标准
Different exchange rate
Current rate: the exchange rate on the balance sheet date
The average rate is the average exchange rate over the reporting period
The historical rate is the actual rate that was in effect when the original transaction occurred
方法
Current rate method
图解
I/S
B/S
科目关系
Nl − Dividend = △RE
A (NI× Average Rate) − Div × Historical Rate I = B
Temporal method
图解
B/S
I/S
关系
RE1 − RE0 = △RE A − RE0 = B
△RE + Dividend = Nl B + Div × Historical Rate = C
Inventory and COGS
Exposure (local currency)
Current method
Temporal method
Ratios analysis after translation
Current method
Pure means from the same source of financial report, B/S or I/S
Pure B/S ratios
Pure I/S ratios
Mixed B/S and I/S ratios
假设
Foreign currency appreciates
Only for end of time figures to calculate the ratios
关系
比较(假设H<A<C)
Translation of entity's FS in a hyperinflationary economy
定义: Cumulative three-year inflation rate exceeds 100%, requires an average of approximately 26% per year
会计处理
IFRS
Principles
Restate the foreign currency financial statements for inflation
Translate the financial statements using the current exchange rate
Procedures of IAS 29
B/S
Monetary assets and liabilities: not restated
Non-monetary assets and liabilities* ending price index/beginning price index
Equity (other than retained earnings)* ending price index/beginning price index
I/S
Revenue*ending price index/average price index
Expense*ending price index/average price index
Purchasing power gain/loss
I/S, a plug for NI to be the right number
Based on net monetary assets or liability(e.g., an inflationary environment for net monetary asset, a loss)
Adjust PPGL with current exchange rate
US GAAP: Do not allow restatement for inflation ,but instead require using temporal rate method
Tax Implications of Multinational Operations
Revenue Growth Issue and Foreign Exchange Risks
Disclosures about foreign currency effect on sales growth in the MD&A
Growth in sales that comes from changes in volume or price is more sustainable than from changes in exchange rates
Analysts will consider the foreign currency effect on sales growth both for forecasting future performance and for evaluating a management team's historical performance
Analysis of Financial Institutions
The difference between financial institutions and non-financial institutions
Difference with other companies
Systematic risk
A risk of disruption to financial services
Financial contagion
Regulated
Mainly financial assets
Global Organizations for regulations
Basel Committee on Banking Supervision
The purposes of the measures contained in Basel III
Improve the banking sector's ability to absorb shocks arising from financial and economic stress, whatever the source
Improve risk management and governance
Strengthen banks' transparency and disclosures
Basel III framework
Minimum required capital
Minimum liquidity: banks must hold enough high-quality liquid assets to cover its liquidity needs in a 30-day liquidity stress scenario
Have a minimum amount of stable funding relative to the bank's liquidity needs over a one-year horizon
International Association Insurance Supervisors(IAIS)
International Organization of Securities Commissions (IOSCO)
Financial Stability Board(FSB)
Individual jurisdictions' Regulatory Authorities
US National Association of Insurance Commissioners (NAIC)
CAMELS model
CAMELS
Capital adequacy
Calculation
Risk-weighted assets: more risky assets require higher level of capital
Risk-weighting is specified by individual regulators
资本类型
Tier 1 capital
Common Equity Tier 1 capital (the most important component): Common stock, additional paid-in capital, retained earnings, OCI, certain adjustments including the deduction of intangibles and deferred tax assets
Other Tier 1 capital: subordinated instruments with no specified maturity and no contractual dividends (e.g., preferred stock with discretionary dividends)
Tier 2 capital: Subordinated instruments with original (i.e., when issued) maturity of more than five years
Requirements of Basel III (a bank must meet all of them)
Common Equity Tier 1 Capital must be at least 4.5% of risk-weighted assets
Total Tier 1 Capital must be at least 6.0% of risk-weighted assets
Total Capital (Tier 1 Capital plus Tier 2 Capital) must be at least 8.0% of risk-weighted assets
Asset quality
Loans (largest portion)
Depend on the creditworthiness of the borrowers and the corresponding adequacy of adjustments for expected loan losses
Investments in securities issued by other entities
At amortized cost (net of allowances)
Management capabilities: successfully identifying and exploiting appropriate profit opportunities while simultaneously managing risk
Earnings sufficiency
Ideally be high quality and trending upward
Accounting estimates are unbiased
The earnings are derived from sustainable
Composition of banks' earnings
Net interest
Service income
Great portion of net interest income and service income is more sustainable
Trading income
Fair value hierarchy
Level 1: inputs are quoted prices for identical financial assets or liabilities inactive markets
Level 2: inputs are observable but are not the quoted prices for identical financial instruments in active markets
Level 3: inputs are unobservable. The fair value of a financial instrument is based on a model (or models) and unobservable inputs
Liquidity position
Liquidity coverage ratio (LCR)
Calculation
Requirements of Basel III
Expected cash flows are the estimated one-month liquidity needs in a stress scenario
The standards recommend a minimum LCR of 100%
Net stable funding ratio (NSFR)
Calculation
Requirements of Basel III: The standards recommend a minimum NSFR of 100%
Others
Concentration of funding: the proportion of funding that is obtained from a single source
Contractual maturity mismatch
Sensitivity to market risk
The sources of market risk: interest rates; exchange rates; equity prices; commodity prices
Mismatches in the maturity of banks' loans and deposits, repricing frequency, reference rates, or currency of banks' loans and deposits create exposure to market movements
Calculation: Value -at -risk (VaR)
Purposes
Evaluate the bank on a CAMELS basis
Equity or debt investment analysis of banks
Analytical Considerations Not Addressed by CAMELS
Government support
Size of the bank
Status of the country’s banking system
Government Ownership
Mission of banking entity
Corporate culture
Competitive environment
Off-balance-sheet items
Segment information
Currency exposure
Risk factors
Basel III disclosures
Insurance company
Property and casualty (P&C)
Distribution
Direct: have their own sales and marketing staff
Agency writers use independent agents, exclusive agents, and insurance brokers
ratios in analyzing companies' profitability
Loss and loss adjustment expense ratio = (Loss expense + Loss adjustment expense)/Net premiums earned
Underwriting expense ratio = Underwriting expense/Net premiums written
Combined ratio = Loss and loss adjustment expense ratio + Underwriting expense ratio
Dividends to policyholders (shareholders) ratio = Dividends to policyholders (shareholders)/Net premiums earned
Combined ratio after dividends = Combined ratio + Dividends to policyholders (shareholders) ratio
Life and health (L&H)
Evaluating Quality of Financial Reports
The quality of financial reports
Reporting quality
Earning quality
Potential problems
Amounts and Timing of Recognition
Classification
Mergers and Acquisitions Issues
Financial Reporting that Diverges from Economic Reality
Evaluating the quality
Beneish Model
公式: M-score = −4.84 + 0.920 (DSR) + 0.528 (GMI) + 0.404 (AQI) + 0.892 (SGI) +0.115 (DEPI) − 0.172 (SGAI) + 4.679 (Accruals) − 0.327 (LEVI)
评价
A higher M-score indicate higher level of earning manipulation
Beneish considered that the likely relevant cutoff for investors is a probability of earnings manipulation of 3.8% (an M-score exceeding −1.78)
各部分计算
LImitations
Relies on accounting data, which may not reflect economic reality
The predictive power is decreasing because it is known by people
Altman Model
公式: Z-score=1.2A+1.4B+3.3C+0.6D+1.0E
各部分计算
A = Net working capital/Total assets
B = Retained earnings/Total assets
C = EBIT/Total assets
D = Market value of equity/Book value of liabilities
E = Sales/Total assets
评价: Higher Z-score, lower probability of bankruptcy
Z<1.81: a high probability of bankruptcy
Z>3.00: a low probability of bankruptcy
1.81<Z<3.00: not clear indicators
LImitations
One-period static model
Depends on accounting data, not market data
Quantitative tools to evaluating earning quality
High-quality earnings:
Sustainable
Adequate
Gauge earnings persistence
Higher accruals mean less reliability
Mean reversion in earnings
Earnings at extreme levels tend to revert back to normal levels over time
Earnings are largely comprised of accruals, mean reversion will occur faster
Evaluating the quality of the financial statements
Cash flow statement
Indicators of Cash Flow Quality (typically on OCF): charactristics of high-quality cash flow)
Positive OCF
OCF derived from sustainable sources
OCF adequate to cover capital expenditures, dividends, and debt repayments
OCF with relatively low volatility (relative to industry participants)
Manipulation cash flow
Large differences between earnings and OCF or increases in such differences can be an indication of earnings manipulation
Timing issues
Selling receivables to a third party
Delaying paying account payables
Classification issues: Shifting positive cash flow items from investing or financing activities to operating activities to inflate OCF
Balance sheet
Completeness
Off-balance-sheet obligations
Take-or-pay contracts
Operating lease
Intercorporate investment methods
Unbiased Measurement
Value of the pension liability (actuarial assumptions)
Value of investment in debt or equity of other companies for which a market value is not readily available
Goodwill value (subjectivity in impairment testing)
Inventory valuation (subjectivity in testing for impairment).
Impairment of PP&E and other assets
Clear Presentation
Sources of information about risk
Financial statements
Auditor's report
Notes to financial statements
Management Discussion and Analysis (MD&A)
SEC Form 'NT' (unable to file required reports timely)
Financial press
Researchers' report
Integration of Financial Statement Analysis Techniques
Framework
DuPont analysis
Three steps
Five steps
NI: not include equity income
Asset turnover: 总资产中无长期股权投资
Leverage: 长期股权投资加回总资产
Capital Allocation Decisions: If ratio of proportional capex to proportional assets is greater(less) than 1, firm is allocating more (less) resources to the segment
Accrual ratio
Balance sheet approach
Operating assets = total assets – cash, cash equivalents and marketable securities
Operating liabilities = total liabilities – total debt
NOA(net operating assets) =Operating assets – operating liabilities
Cash flow statement approach
Accruals of cash flow=NI–CFO-CFI
Cash Flow Analysis
Operating cash flow deducts interest and taxes while operating income does not, so adding-back cash interest and cash taxes to CFO. If the company is reporting under IFRS and choses to classify interest expense as a financing cash flow, the only necessary adjustment is for taxes
Cash basis ratios
Cash flow to operating income = CFO before interest and taxes/EBIT
Cash return on total assets = CFO before interest and taxes/average total assets
Cash flow interest coverage = CFO before interest and taxes/cash interest paid
Cash flow to total debt = CFO before interest and taxes/total debt
Cash flow to reinvestment = CFO before interest and taxes/capital expenditures
Financial Statement Modeling
Process
Income Statement Modeling
Revenue Forecast Approaches
Top-down approach
Growth relative to GDP growth
First forecasts the growth rate of nominal GDP
Then considers how the growth rate of the specific company being examined will compare with nominal GDP growth
Market growth and market share
First forecasts growth in a particular market
Then considers the company's current market share, and how it is likely to change over time
Bottom-up approach
Time series
Returns-based measure: forecasts based on balance sheet accounts
Capacity-based measure: forecasts based on same-store sales growth (for stores that have been open for at least 12 months) and sales related to new stores
Hybrid approach
利润表科目关系: 见CFA一级 Financial statement analysis
Economies of Scale
Characteristics
Average costs per unit of a good or service produced fall as volume rises
Gross and operating margins tend to be positively correlated with sales levels
出现情况: include high fixed costs, higher levels of production, greater bargaining power with suppliers, and lower per unit advertising expenses
Evidence
Lower proportion of COGs
Lower proportion of SG&A
预测项目
COGs
公式
Forecast COGS = (historical COGS/ revenue) (estimate of future revenue)
Forecast COGS = (1-gross margin) (estimate of future revenue)
Competitors' gross margins
Gross margin differences among companies within a sector should logically relate to differences in their business operations
Differences in competitors' gross margins could simply reflect differences in business models
Analysts' consideration
A small error in this item can have a material impact on the forecasted operating profit
Whether an analysis of these costs can improve forecasting accuracy
The impact of hedging strategy
SG&A expenses
Selling and distribution expenses often have a large variable component and can be estimated as a percentage of sales
Other general and administrative expenses are less variable
Financing expenses
Net debt: gross debt Less cash, cash equivalents, and shortterm deposits
Net interest expense: Interest expense minus interest income
Income tax expense
Types of tax rates
The statutory tax rate
The statutory tax rate: =income tax expense/EBT
The cash tax rate: tax actually paid (cash tax)/EBT
Tax expense = Tax payable + changes in deferred tax liabilities - changes in deferred tax assets
Reasons for differences between the statutory tax rate and the effective tax rate: Tax credits, withholding tax on dividends, adjustments to previous years, and expenses not deductible for tax purposes
Balance Sheet Modeling
Working capital items
Inventories= (inventory days on hand)×(COGS/365)
Accounts receivable=(days sales outstanding)×(revenues/365)
Accounts payable=(days payable outstanding)×(COGS/365)
PP&E
Depreciation and amortization forecasts are usually based on historical depreciation, management's disclosures, and levels of long-term assets
Capital expenditures can be thought of as including both maintenance capital expenditures and growth capital expenditures
Cash Flow Statement Modeling
Net income (I/S)
Share based compensation
Working capital
Depreciation & amortization
CFO
Capital Expenditure (CapEx)
CFI
Share repurchase and issurance
Dividends
Debt issurance and repayment
CFF
Building a Financial Statement Model
Pro forma income statement estimation
Revenue (growth and future revenue)
COGS: % of sales (consider: business strategies or regions)
SG&A: Fixed or % of sales
Financing costs: Debt * interest rates (consider: anticipated changes in capital expenditures or financial structure)
Income tax expense and cash taxes
Effective rates and trends (changes in deferred tax segments)
Segment information (growth in high- and low-tax segments)
Pro forma balance sheet estimation
Working capital (i.e. A/R, A/P, and inventory): Based on estimation of the pro forma income statement
Depreciation and capital expenditures: % of sales (consider: align with company's growing assumption)
Pro forma cash flow statement estimation: Based on pro forma income statement and balance sheet
Behavioral Financial and Analyst Forecasts
Overconfidence in Forecasting
Illusion of Control
Conservatism Bias
Representativeness Bias
Confirmation Bias
The Impact of Competitive Factors in Price and Costs
Porter's Five Forces
The companies have limited pricing power
The companies face downward pressure on profitability
ROIC&ROCE
Return on invested capital (ROIC)
ROIC=EBIT(1-T)/Invested capital
Invested capital=operating assets - operating liabilities
Return on capital employed (ROCE)
ROCE=EBIT/captial employed
ROCE can be useful with different tax structures
Inflation and Deflation
Industry sales
Most increases in the cost of inputs: Commodities or labor
Result in higher prices for end products
Company sales: The impact of higher prices on volume depends on the price elasticity of demand
Industry costs
Company costs: it is often helpful to segment the cost structure by category and geography
Technological Developments
Impacts on demand curve
Scenario and/or sensitivity analysis
Long-Term Forecasting
The investment strategy for which the stock is being considered
Cyclicality of the industry
Company specific factors
The analyst's employer's preferences