导图社区 認識 R
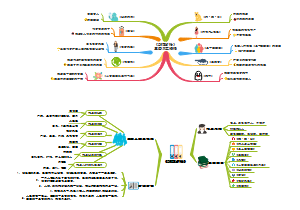
認識 R
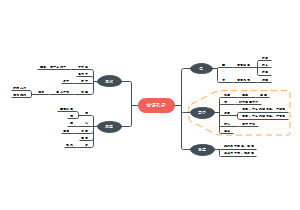
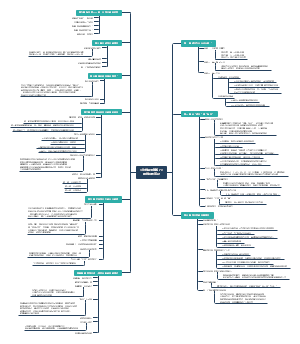
認識 R思维导图,主要包含了What 、 WHY、 Which、基本操作等。
编辑于2024-04-15 19:17:56- 基本操作
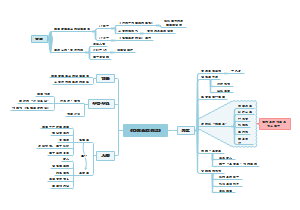
- 比例
这是一篇关于比例的思维导图,主要内容包括:定义,比例的性质,比例的计算,比例在日常生活中的应用,比例在艺术中的应用,比例在科学中的应用,比例在教育中的应用,比例的视觉表示,比例的计算工具,比例的误解和误区,比例的教育意义,比例的未来研究方向。
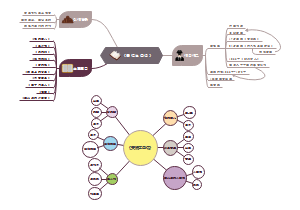
- 豆瓣高分电影清单
这是一篇关于豆瓣高分电影清单的思维导图,主要内容包括:激励成长的电影,拓宽视野的电影,感悟爱情的电影,启发思考的电影,增强团队精神的电影,激发创新思维的电影,感受历史的电影,探索宇宙的电影,感受艺术的电影,理解多元文化的电影,学习领导力的电影,感受友情的电影,探索自我发现的电影,感受亲情的电影,感受自然的电影,感受勇气的电影,感受责任的电影。
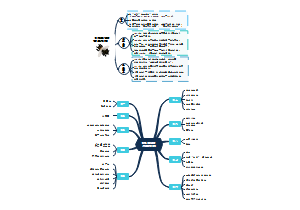
- 大学新生:微博热搜借势术
这是一篇关于大学新生:微博热搜借势术的思维导图,主要内容包括:理解微博热搜机制,大学新生相关热搜话题,借势营销策略,微博运营技巧,危机管理与应对,案例分析与经验总结。
認識 R
社区模板帮助中心,点此进入>>
- 比例
这是一篇关于比例的思维导图,主要内容包括:定义,比例的性质,比例的计算,比例在日常生活中的应用,比例在艺术中的应用,比例在科学中的应用,比例在教育中的应用,比例的视觉表示,比例的计算工具,比例的误解和误区,比例的教育意义,比例的未来研究方向。
- 豆瓣高分电影清单
这是一篇关于豆瓣高分电影清单的思维导图,主要内容包括:激励成长的电影,拓宽视野的电影,感悟爱情的电影,启发思考的电影,增强团队精神的电影,激发创新思维的电影,感受历史的电影,探索宇宙的电影,感受艺术的电影,理解多元文化的电影,学习领导力的电影,感受友情的电影,探索自我发现的电影,感受亲情的电影,感受自然的电影,感受勇气的电影,感受责任的电影。
- 大学新生:微博热搜借势术
这是一篇关于大学新生:微博热搜借势术的思维导图,主要内容包括:理解微博热搜机制,大学新生相关热搜话题,借势营销策略,微博运营技巧,危机管理与应对,案例分析与经验总结。
- 相似推荐
- 大纲