导图社区 世界投资报告2024国际投资趋势
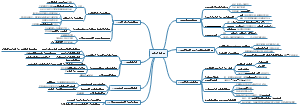
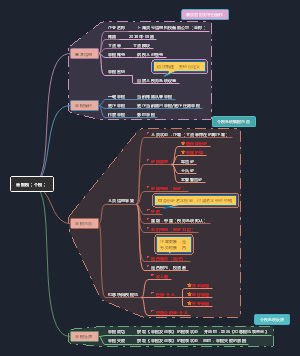
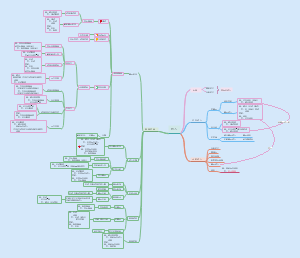
这是一篇关于世界投资报告2024国际投资趋势思维导图,板块 A 聚焦外国直接投资,分析全球 FDI 整体走向,从地域维度解读全球 FDI 流入、流出的变化特征,同时按项目类型与行业划分,介绍绿地投资、跨境并购等不同投资项目的发展态势。板块 B 围绕可持续发展目标相关投资展开,剖析投资缺口与行业趋势,介绍绿地投资作为对冲手段的作用,对比不同国家、区域之间的投资不均衡现状,解读各国可持续发展相关投资的差异。板块 C 讲解国际生产相关内容,阐述跨国企业在全球经济中的重要价值,展示头部跨国公司国际化发展趋势,解读生产网络重塑现象,梳理头部百强跨国企业投资模式的变迁,涵盖绿地投资历史趋势、股权收购与资产剥离等相关动态。报告整合各项关键指标,客观呈现全球跨国投资格局、行业变化以及地域差异,完整展现当下国际投资的全貌。无论学习国际经济课程、研究跨境投资趋势的学生,还是需要快速掌握这份报告核心要点的从业者,都可以借助这份导图高效梳理知识。
提示: 本内容由社区用户上传并分享。平台不对内容的真实性、合法性、知识产权归属及是否侵害第三方权利进行事前审核或保证。本内容可能包含受版权保护的图片、字体或其他第三方素材,使用前请自行确认授权范围。
World Investment Report 2024 International investment trends
A. Foreign direct investment
Global trends
In 2023, FDI(foreign direct investment) flows amounted to $1.33 trillion, 2 per cent less than in 2022. Excluding the effect of European conduit economies, global inflows declined by more than 10 per cent.
FDI(foreign direct investment) inflows to developing economies decreased by 7 per cent, and those to developed economies, net of conduits, fell by 15 per cent.
M&As(mergers and acquisitions) ended 2023 at just over half the value seen in 2022, and international project finance deals were down by about a quarter. Greenfield project announcements increased marginally, with the growth concentrated in manufacturing and developing countries.
The global environment for international business and cross - border investment remains challenging in 2024. However, MNE(multinational enterprise) profit levels remain high, financing conditions are easing, and the growth in greenfield project announcements in 2023 may lead to modest growth for the full year.
Trends by geography
FDI inflows
Developed countries accounted for 35 per cent of global FDI flows in 2023. In Europe, FDI inflows shifted from -$106 billion in 2022 to $16 billion in 2023, but excluding some countries, inflows to the rest of Europe declined by 14 per cent. North America and most other developed regions also experienced a decline in FDI inflows.
Developing economies attracted 65 per cent of global FDI flows in 2023, with a 7 per cent decrease. Developing Asia, the largest FDI recipient, saw an 8 per cent decline. In contrast, FDI inflows to least developed countries (LDCs) increased, and their share in global FDI grew from 2 to 2.4 per cent.
Among the top 20 host economies, the United States remained the largest FDI recipient, accounting for almost a quarter of the global total. China and Hong Kong, China accounted for a further 21 percent.
FDI outflows
In 2023, FDI flows from developed economies increased by 4 per cent to $1.1 trillion. The United States and Japan had increased outward FDI, while European countries (excluding five conduit countries) had a 11 per cent decrease.
FDI outflows from developing economies slowed by 11 per cent in 2023, to $491 billion. However, greenfield projects announced by MNEs based in developing countries increased by 23 percent in number and by 35 per cent in value.
Trends by project type and sector
Project types
Greenfield investment:
The overall increase in greenfield announcements was driven by a significant rise in manufacturing projects. The announced value of greenfield projects rose by 5 per cent to $1.4 trillion, the highest level ever recorded.
International project finance:
The number of international project finance deals declined by 26 per cent in 2023. Project finance deals in renewable energy also declined, and the average cost of debt has substantially increased.
Cross - border mergers and acquisitions:
Cross - border M&As sales were down by 46 per cent in 2023, primarily due to the decline in the services sector, especially in the ICT (Information and Communication Technology) sector.
Selected industries
Infrastructure:
The decline in the value and number of project finance deals in 2023 affected the infrastructure sector. Most infrastructure projects were in renewable energy, and there is evidence of a switch between project finance and greenfield FDI as financial conditions change.
Global value chain - intensive industries:
GVC - intensive industries registered a significant increase in investment projects. Growth in the automotive sector is driven by strong demand for hybrid and fully - electric vehicles.
Digital industries:
After the pandemic, digital industries expanded rapidly, but in 2023, the number of digital industries project announcements returned to close to pre - pandemic levels, with a significant decline.
Extractive sectors and critical minerals:
Greenfield project announcements in mining and critical minerals (including processing) increased significantly in 2023, doubling in both number and value.
B. Investment in the Sustainable Development Goals
Investment Gap and Sectoral Trends
Gap Exacerbation:
The drop in international project finance in 2023 exacerbated the $4 trillion investment gap for achieving the Sustainable Development Goals (SDGs) in developing countries. This shortfall hinders progress towards the 2030 Agenda.
Sectoral Declines:
Several SDG - relevant sectors witnessed a decline in project numbers. In 2023, the number of projects in agrifood systems and water and sanitation was lower compared to 2015 when the Goals were adopted. Infrastructure - related project finance, a major source of investment for these sectors, decreased significantly, affecting overall SDG investment flows.
Greenfield Investment as Counterweight
Growth in Greenfield Investment:
Greenfield investment provided some offset to the decline in international project finance. The value of cross - border greenfield project announcements for SDG - relevant sectors grew by 14 per cent in 2023, and the number of projects increased by 19 percent.
Sectoral Concentration:
However, the growth was concentrated in a few sectors. Transport services accounted for about half of the increase in project numbers and values, and renewable energy accounted for about one - quarter. Meanwhile, investment in sectors like agrifood, health and education, and WASH declined.
Regional and Country - Level Disparities
LDCs' Limited Share:
Least developed countries (LDCs) had a small share of SDG - relevant investment among developing countries. In 2023, the combined value of relevant greenfield investment and international project finance deals in LDCs was only about 13 per cent of the total in developing countries. A $34 billion green hydrogen project in Mauritania accounted for more than half of LDCs' total.
Regional Inequality:
The distribution of SDG investment across developing regions was unequal. Only developing Asia attracted above - average greenfield projects and international project finance in SDG - relevant sectors. Africa, despite some investment in power, infrastructure, and renewable energy, had less progress in other SDG - relevant sectors. For example, its share in health - related investment was only about 5 per cent of the total value in developing countries.
C. International production
Key indicators of international production
Importance of MNEs in Global Economy:
Despite the sluggish growth of international investment in the past decade, international production through multinational enterprises (MNEs) remains crucial. FDI flows as a percentage of gross fixed capital formation, production of foreign affiliates as a share of global output, and sales of foreign affiliates all highlight the significance of FDI in the globalized economy.
Reshaping of Production Networks:
The global economy's significant changes are reshaping international production networks and global value chains (GVCs). There are three types of divergence: the growth of FDI and GVCs has decoupled from GDP and trade; there is a widening gap in investment trends between manufacturing and services sectors; and China's investment patterns have delinked from the rest of the world. Geopolitical differences and global crises have led to a transition from divergence to fracturing, making geopolitical factors more important in investment decisions.
Internationalization trends of the largest MNEs
Overall Transnationality Index Change:
The average transnationality index of the top 100 non - financial MNEs increased marginally in 2023. This was driven by MNEs in the automotive industry, where the transition to electric vehicles (EVs) and new technologies attracted more foreign investment.
Industry - Specific Trends
Automotive Industry:
The 12 car producers in the top 100 significantly expanded their international networks, focusing on the US and China, the two largest EV markets. For example, after the US' Inflation Reduction Act in 2022, top automotive MNEs announced large - scale greenfield projects in the EV and battery supply chain.
Technology Industry:
The number of technology MNEs in the top global rankings remained steady. Key trends included competition in artificial intelligence and machine learning, and consolidation in neighbouring industries. Some companies, like Microsoft, expanded their foreign assets through acquisitions, while others, such as Apple, scaled down operations in China.
Pharmaceutical Industry:
The pharmaceutical industry saw a modest expansion of its international footprint. Ten MNEs drove growth through strategic acquisitions, such as Pfizer's merger with Seagen, which increased its foreign assets.
Shifting investment patterns among the top 100 MNEs
Historical Greenfield Investment Trends:
Over the last 10 years, two - thirds of greenfield investment by the top 100 MNEs was related to setting up services subsidiaries. Even in strategic manufacturing sectors like automotive and pharmaceuticals, more than half of the greenfield projects focused on non - manufacturing activities.
Recent Geographical Shifts:
Since 2019, the geographical distribution of manufacturing projects has shifted towards locations closer to MNE home markets, especially in strategic sectors. Europe and North America have become primary destinations, and Central America, North Africa, and West and Central Asia have also gained importance. For example, automotive and pharmaceutical MNEs have increased investment in these regions. In contrast, the number of strategic manufacturing projects in East Asia decreased.
Equity Acquisitions and Divestment Trends:
The number of equity acquisitions since 2019 decreased by a little more than 10 per cent. M&A deals are more prevalent in developed economies, and trends in M&As are consistent with those in greenfield projects. Divestment trends among the top 100 MNEs do not show a clear relocation strategy, and the number of divestments from China has decreased, indicating the importance of the Chinese market.