导图社区 IGCSE地理 1.1 population dynamic, 1.2 migration
- 64
- 0
- 0
- 举报
IGCSE地理 1.1 population dynamic, 1.2 migration
Parents often have many children to compensate of these expected deaths (most in LEDCs)。
编辑于2022-12-26 18:46:20 上海- IGCSE
- 相似推荐
- 大纲

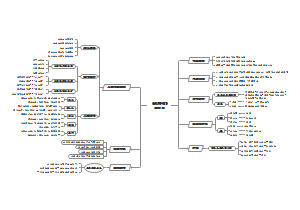

1.1 Population dynamic
Demographers: people who study human populations
The rapid increase in the world’s population
*Faster rate of growth in least developed countries
1800-1950, after World War II growth in rich country
1960s, highest 2.4% annual (population explosion )
NOW, Rate of growth falling for four decades, 1.1%
Demographic momentum (number of people added each year) remains very high, because of huge number of woman in birth age
FUTURE, little or no growth in developed countries, much are from immigration
Over population&under population
Carrying capacity: the largest population that the resources of a given environment can support.
Over-population: lead to a decrease in standard of living for the population as a whole.
Optimum population: the size of population that permits the full utilization of the natural resources of an area, giving maximum per people output and standard of living
Under-population: population is too small to develop its resources effectively
Effects of increasing population
Positive: allows a fuller exploitation of resource, cause living standards to rise
Negative: increase pressure on resources, cause living standard to decline
Facts that shows human population is against the limit of Earth’s resources
1/4 of children have protein-energy malnutrition
The long-term trend for grain production per person is falling
40% agricultural land is slightly degraded and 9% is highly degraded
Water scarcity occur in every continent, 40% people in the world
1/4 of all fish stocks are overharvested
Global peak oil production will come as early as the next decade
Issues of over-population
Intense competition for land
Heavy traffic congestion
High house price
High environmental impact of economic activity
Pressure on eater resources
The causes of a change in population size
A) Rate of natural change: the difference between the birth rate and the death rate. (Natural increase&natural decrease)
Death rate: number of deaths per thousand population in a year
Birth rate: number of births per thousand population in a year
B) net migration: the balance between immigration and emigration
Immigration rate: number of immigrants per thousand population entering a receiving country in a year
Emigration rate: number of emigrants per thousand is population leaving a source country in a year
#DTM model (demographic transition model)
Stage 1: high stationary
BR high, stationary
DR high, fluctuating (disease, war and famine)
Natural growth, slow
High infant mortality rate, low life expectancy
High young dependents
Pre-industrial, most people live in rural area, dependent on agriculture
Stage 2: early expanding
BR remains high (social norm governing fertility take time to change)
DR decrease (better nutrition, improved public health, clean water supply, efficient sewerage system, medical advances)
Rate of natural increase raise to a peak
Infant mortality rate fall, life expectancy increase
Young dependents increase
Rural-to-urban migration takes place
Stage 3: late expanding
BR decrease
DR remains low
Rate of natural increase slows down
Infant mortality rate decrease, life expectancy increase
Relatively young population structures (usually have lower death rates than nations in stage4 or stage5)
Urbanization generally slows
demographic dividend
Stage 4: low stationary
BR low (slightly higher than DR)
DR low
Natural increase low
BR fluctuating, due to changing economic conditions
DR rise slightly, due to average age increase
Life expectancy improve, age-specific mortality rate fall
Stage 5: natural decrease
BR low (below death rate)
DR low
Natural decrease (if without immigration)
Take place in a limited but increasing number of countries, mainly European
High old dependents
High urbanization level
Contrasts in demographic transition
Details: difference from previous developing countries and present developing countries
BR in stage1-2 were generally higher
DR fell much more steeply
Greater population growth in stage2-3 due to larger base populations
Steeper fall in fertility rate in stage3
Much weaker relationship between population change and economic development
Reasons:
BIRTH: Factors affecting fertility
Fertility rate: the number of live birth per 1,000 women aged 15–49 in one year
Total fertility rate: the average number of children a woman has during her lifetime
A) Demographic:
Infant mortality rate: the number of deaths of children under 1 year of age per 1000 live birth per year
Parents often have many children to compensate of these expected deaths (most in LEDCs)
B) Social&cultural:
Low status of woman
Higher fertility
Without family planning
Woman produce as many children as possible
Female literacy (woman emancipation)
Lower fertility
Have knowledge of contraception
Greater social awareness
More opportunity of employment
Wider choice of action
Education
1-extending education opportunities
2-lower population growth
3-increasing prosperity
Religion
Oppose artificial birth control
Be forbidden to abortion
C) Economic:
a) Higher fertility rate in less developed countries
Children are economic asset
Little support to the elders, need for support from children
b) Lower fertility rate in more developed countries
Cost of the child dependency years
People get marry later, shorter time for reproducing
Effects of economic growth
Greater spending on health, housing, nutrition and education
Lower mortality, reducing fertility rate
D) Political:
Population policy: government try to influence population size, growth, distribution or composition for economic and strategic reasons
Pro-natalist policy: to encourage more birth, stop population decline
Anti-natalist policy: to encourage fewer birth, reduce population growth
Encourage migration: to modify the distribution of the population
DEATH: Factors affecting mortality
Life expectancy at birth: average number of years a newborn infant can expect to live under current mortality levels
Social&economic factors causes high rates of infectious disease
Poverty
Live in overcrowded condition
Less of clean water, sewage system
Poor access to healthcare
Unable to get a treatment
Antibiotic resistance
Poor nutrition causes deficient immune system
Changing human migration patterns
New infectious agents
Solutions:
Public education
disinfect
#Mortality due to HIV/AIDS
Facts
Eastern and Southern Africa, 19 million people living with HIV, highest number of AIDS-related death
2.1 million people become newly infected with HIV
From 2010 to 2015, number of people dying from AIDS in Middle East and North Africa increased by 22%
Causes
Poverty and social instability that result in family disruption
High levels of other sexually transmitted infections
The low status of woman
Sexual violence
High mobility, link ti migratory labour systems
Ineffective environment
Impact
Labour supply
Economic active population reduce as more people fall sick and unable to work
Severe impact on development
Threatened food security as there are fewer people able to farm
Dependency ratio
People contract HIV are mainly in the economic active population, increase death rate in this age group, increase dependency ratio
Family
Household dissolved
Impoverishing entire family, many children and old people have to take on the role of carers
Parents dead, cause large number of orphaned children, strain in governments
Education
With limited investment in education, people are unaware about how to avoid HIV/AIDS
Teachers who have AIDS are too ill to work
Poverty
AIDS impede development, increase the impact of poverty
Poverty worsens the AIDS situation, people can’t pay for treatments.
Infant and child mortality
AIDS can be passed from mother to child
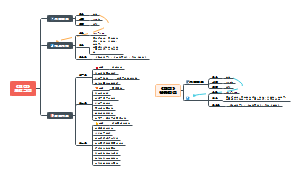
1.2 Migration
Migration: the movement of people across a specific boundary, to establish a new permanent place of residence
National & international
Voluntary & involuntary
Push and pull factors
Push factor: negative conditions at the point of origin that encourage or force people to move
Poor employment opportunities
low income
House shortage
Social upheaval
No freedom of speech
Adverse climate
It is predicted that climate change will force mass migrations in the future
Natural disasters
Pull factor: positive conditions at the point of destination that encourage people to migrate
Good job prospects
High wage
Improved housing
Freedom of speech
High standard of living
Wide range of amenities
Attractive environment
Voluntary and involuntary migrations
Voluntary migration: the individual has a free choice about whether to migrate or not
Higher salaries
More employment opportunities
Retirement to a warmer climate
Involuntary (forced) migration: people move against their will
Religious discriminations
political persecution (need for political asylum)
Famine (scarcity of food)
Natural disasters
War
Refugee: people who must leave their home area for their own safety or survival
International and internal migrations
International migration
Migration of foreign labour, international student, high skilled workers has become increasingly temporary and circular in nature
While many traditional migration streams have remained strong, some new streams have developed
48% are female migrants
Migrants move from developing to developed countries
Developed countries have reinforced controls, to response to security issues, also to combat illegal immigrants
Globalization brings benefits to both developed and developing countries
Internal migration
Rural-to-urban migration: most of the population movement within countries
Rural depopulation: an absolute decline in the population of an area, usually due to a high level of out-migration
1) Urbanization
2) Counterurbanization: the process of population decentralization as people move from large urban area to smaller urban settlements and rural areas
To seek a better quality of life by getting away from the problems of large cities
Impacts of migration
Origin countries
positive
Remittance as a major source of income in some countries
Money sent back by migrants to their families in their home community
Ease the level of unemployment and underemployment
Reduce pressure on health, education services and on housing
Return migrants can bring new skills, ideas and money into a community
Negative
Loss of young adult workers who may have vital skills (the ‘brain-drain’ effect
An ageing population in communities with a large outflow young migrants
Agricultural output reducing if the labour force falls below a certain level
Migrants returned may question traditional values, causing divisions in the community
Destination countries
Positive
Increase the pool of available labour may reduce the cost of labour for businesses, help reduce inflation
Migrants may bring important skills to the destination
Increasing cultural diversity can enrich receiving communities
Young migrants can reduce the rate of population ageing
Negative
Migrants take jobs from people in the long-established population (cause unemployment to local people)
Increase pressure on housing stock and on service, such as health and education
Change in the ethnic balance of a country or region may cause tension
A large population can have a negative impact on the environment
Migrants
Positive
Higher wage than in the origin country
Wider choice of job opportunities
A greater opportunity to develop new skill
Have ability to support family members by remittances
Have the opportunity to learn a new language
Negative
The cost of migration can be high
Separate from family and friends in origin country
Hard to settling into a new culture (assimilation)
Can be exploited by unscrupulous employers (be screwed)
Especially illegal migrants, many migrants can involve hazardous journeys