导图社区 9 Portfolio Management
- 77
- 1
- 1
- 举报
9 Portfolio Management
2022年CFA一级科目Portfolio management, 新增考试内容behavioral finance
编辑于2022-06-27 15:40:32- 2024cpa会计科目第17章收入、费用和利润
2024cpa会计科目第17章,本章属于非常重要的章节,其内容知识点多、综合性强,可以各种题型进行考核。既可以单独进行考核客观题和主观题,也可以与前期差错更正、资产负债表日后事项等内容相结合在主观题中进行考核。2018年、2020年、2021年、2022年均在主观题中进行考核,近几年平均分值 11分左右。
- 2024cpa会计科目第十二章或有事项
2024cpa会计科目第十二章,本章内容可以各种题型进行考核。客观题主要考核或有资产和或有负债的相关概念、亏损合同的处理原则、预计负债最佳估计数的确定、与产品质量保证相关的预计负债的确认、与重组有关的直接支出的判断等;同时,本章内容(如:未决诉讼)可与资产负债表日后事项、差错更正等内容相结合、产品质量保证与收入相结合在主观题中进行考核。近几年考试平均分值为2分左右。
- 2024cpa会计科目第十一章借款费用
2024cpa会计科目第十一章,本章属于比较重要的章节,考试时多以单选题和多选题等客观题形式进行考核,也可以与应付债券(包括可转换公司债券)、外币业务等相关知识结合在主观题中进行考核。重点掌握借款费用的范围、资本化的条件及借款费用资本化金额的计量,近几年考试分值为3分左右。
9 Portfolio Management
社区模板帮助中心,点此进入>>
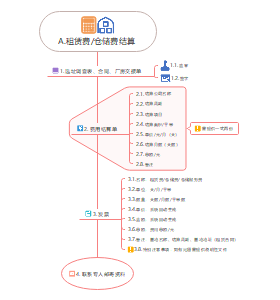
- 2024cpa会计科目第17章收入、费用和利润
2024cpa会计科目第17章,本章属于非常重要的章节,其内容知识点多、综合性强,可以各种题型进行考核。既可以单独进行考核客观题和主观题,也可以与前期差错更正、资产负债表日后事项等内容相结合在主观题中进行考核。2018年、2020年、2021年、2022年均在主观题中进行考核,近几年平均分值 11分左右。
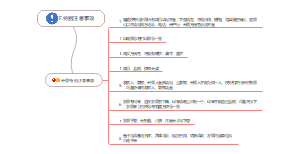
- 2024cpa会计科目第十二章或有事项
2024cpa会计科目第十二章,本章内容可以各种题型进行考核。客观题主要考核或有资产和或有负债的相关概念、亏损合同的处理原则、预计负债最佳估计数的确定、与产品质量保证相关的预计负债的确认、与重组有关的直接支出的判断等;同时,本章内容(如:未决诉讼)可与资产负债表日后事项、差错更正等内容相结合、产品质量保证与收入相结合在主观题中进行考核。近几年考试平均分值为2分左右。
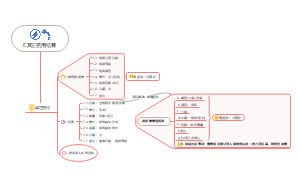
- 2024cpa会计科目第十一章借款费用
2024cpa会计科目第十一章,本章属于比较重要的章节,考试时多以单选题和多选题等客观题形式进行考核,也可以与应付债券(包括可转换公司债券)、外币业务等相关知识结合在主观题中进行考核。重点掌握借款费用的范围、资本化的条件及借款费用资本化金额的计量,近几年考试分值为3分左右。
- 相似推荐
- 大纲


Portfolio Management
Portfolio management overview
A portfolio approach to investing
Avoiding Disaster
Reduce Risk more than increase returns
Composition Matters for the Risk–Return Trade- off
Steps in the portfolio management process
The Planning Step 计划
Understanding the client's needs
Preparation of an investment policy statement (IPS)
The Execution Step 执行
Asset allocation
Security analysis
Portfolio construction
The Feedback Step 反馈
Portfolio monitoring and rebalancing
Performance measurement and reporting
Types of investors
Individual investors
Institutional investors
Perpetual
University endowment
Foundation
The asset management industry
Active versus Passive Management
Traditional versus Alternative Asset Managers
Ownership Structure
Asset Management Industry Trends
Growth of Passive Investing
Use of "Big Data" in the Investment Process
Robo- Advisers: An Expanding Wealth Management Channel
Pooled investments
Mutual funds
Open-end funds: Investors can buy and redeem the mutual fund shares at net asset value
Trading prices are close to the net asset value of the fund;
Not fully invested as some cash kept for redemption;
Fee charged: management fees, upfront fees, redemptionfees
不在二级市场交易
Closed-end funds: No new investments are accepted
Number of shares issued does not change
Investors can only liquidate the shares by selling them to other investors,可能于二级市场交易
Traded at a premium or discount to net asset value;
Could be fully invested
ETF&mutual fund
Private equity
Buyout funds
Venture capital funds
Hedge funds
Separately Managed Accounts
Portfolio Risk and Return
Part Ⅰ
Investment characteristics of assets
Return
Holding period return
Arithmetic (mean) return
Geometric mean return
Money-weighted return (similar to IRR): 在现金流变化较大时可以使用
Other major return measures and their applications
Gross and Net Return: fees
Pre- tax and After- tax Nominal Return
Real Returns: inflation
Leveraged Return
Risk
Variance
Sample variance
Standard deviation
Portfolio of Two Risky Assets
Risk aversion and portfolio selection
The concpet of risk aversion
Risk Seeking: actually prefers more risk to less and, givenequalexpected returns, will choose the more risky investment
Risk Neutral: means that the investor cares only about return and not about risk
Risk Averse : simply one that dislikes risk
Utility theory and indifference curves
Utility
Definition: s a measure of relative satisfaction from consumption of various goods and services or in the case of investments, the satisfaction that an investor derives from a portfolio
计算
公式
各部分含义
U is the utility of an investment
E(r) is the expected return
σ2 is the variance of the investment
A is a measure of risk aversion
A>0, when investor is risk-averse
A=0, when investor is risk-neutral
A<0, when investor is risk-seeking
Indifference Curves
Introduction
An indifference curve plots the combinations of risk–return pairs that an investor would accept to maintain a given level of utility
Different types
The curves slope upwardly and getting steeper. Higher utility corresponding to a more left or upward indifference curve
The most risk- averse investor has an indifference curve with the greatest slope. The more risk-averse the investor, the steeper the curve
Portfolio risk
Portfolio of two risky assets
Portfolio Return: as a weighted average of the returns in the portfolio
Portfolio risk
Covariance
Correlation
Portfolio variance and standard deviation
特殊情况
ρ12 = +1: Returns of the two assets are perfectly positively correlated
ρ12 = –1: Returns of the two assets are perfectly negatively correlated
ρ12 = 0: Returns of the two assets are uncorrelated
Achieved diversification by combining two assets that are not perfectly correlated
图形
Portfolio of many risky assets
Portfolio Return: = w1R1 + w2R2 + … + wnRn
Portfolio Risk
Efficient frontier and investor's optimal portfolio
Efficient frontier of risky assets
The Markowitz assumptions
Risk aversion
Investment return can be measured by expected returns
Risk is measured in terms of variance(standard deviation)
Decision making is based on expected return and the risk
Utility maximization
Efficient frontier of risky assets
Efficient frontier
Portfolios above efficient frontier is not achievable
Portfolios below efficient frontier is un-efficient
图形
Terms
Minimum-variance frontier of risky assets: Portfolio that have the lowest risk of all portfolios given a certain level of return
Global minimum-variance portfolio: The investment portfolio that has the lowest variance
Efficient frontier of risky assets ( well-diversified )
Effective portfolio provides the lowest risk at a certain level of return and offers the highest return given certain level of risk
All risky assets are contained
Capital allocation line (CAL)
定义: The portfolios available to an investor through combining the risk-free asset with one risky asset (well-diversified portfolio).
图形
CAL(P) is the optimal capital allocation line, which is tangent to efficient frontier of riskyassets. Portfolio P is the optimal risky portfolio
曲线方程
Optimal investor portfolio
Investor should choose portfolio "C" to invest as it supplies the most satisfaction
Optimal Portfolio Along CAL
More risk-averse investor (A1= 4 )will select portfolio "j" (less in risky asset), and less risk-averse investor(A2 =2 )will select portfolio "k" (more in risky asset)
Optimal risky portfolio & Optimal investor portfolio
Investors' expectations
Different investors have different expectations
The expected returns
Standard deviations
Correlations
The optimal risky portfolio is also different because of investors' expectations
The two fund separation theorem
Hold a combination of two portfolios or funds: a risk- free asset and an optimal portfolio of risky assets
Two distinct steps
Investment decision: the investor identifies the optimal risky portfolio
Financing decision
Lending portfolio
Borrowing portfolio
Part Ⅱ
The capital market theory
Capital market line (CML)
Assuming all investors have a homogeneous expectation: all investors have identical efficient frontier of risky portfolio and identical optimal risky portfolio, which is the market portfolio
CML is a special CAL that includes all possible combinations of risk-free asset and market portfolio
CML is tangent to the efficient frontier at a point representing market portfolio
Market portfolio
Systematic and nonsystematic risk
Systematic risk
定义: Risk affects the entire market or economy, which cannot bea voided and is inherent in the overall market
Caused by macro factors: interest rates, GDP growth, supply shocks
Measured by Beta (β) of the asset
Nonsystematic risk
Risk can be reduced or eliminated by holding well-diversified portfolios
Because diversification is cost-free, investors are only rewarded for taking systematic risks
Types: Financial risk, business risk, credit risk
Calculation and interpretation of β
Beta (β)
定义: A measure of systematic risk of an asset, representing how sensitive an asset's return is to the market as a whole
计算
Model
Single-factor model (Market Model)
Multi-factor Model
βi,k: the sensitivity of excess return on risk factor k Fk: factor k
The capital asset pricing model (CAPM)
Assumptions
Investors are risk averse, utility-maximizing, rational individuals
Markets are frictionless, including no cost and no taxes
Investor plan for the same single holding period
Investor have homogeneous expectations or beliefs
All investments are infinitely divisible
Investors are price takers
CAPM
公式
Description
The expected return (required return) only measured by beta (Systematic risk)
Expected return (required return) obtained from the CAPM isused for assets valuation by investors and capital budgeting
Security market line (SML)
直线方程
Intercept is Rf, slope is the market risk premium (Rm-Rf)
图形
描述
Any asset or portfolio that are properly priced plots on SML
Any asset or portfolio that are overpriced plots below SML
Any asset or portfolio that are underpriced plots above SML
Comparison between CML and SML
Portfolio performance appraisal measures
Basic of Portfolio Planning and Construction
Portfolio planning
The investment policy statement (IPS)
Understanding of the client's situation and requirements
A typical format of IPS will include the client's investment objectives and the constraints that apply to the client's portfolio
The client's objectives are specified in terms of risk tolerance and return requirements
Major components of an IPS
Introduction
Purpose
Duties and responsibilities
Procedures
Objective
Risk objectives
Quantitative
Absolute risk objectives
Relative risk objectives
Downside risk objectives
Risk tolerance
关系
Ability to bear risk: depends on investment horizon, insurance, income, wealth, financial responsibilities
Willingness to bear risk: depends on attitudes and beliefs about investment risk
选择
If willingness > ability: go with ability
If ability > willingness: educate but do not attempt to change personality/psychological characteristics
Return objectives
Absolute return objectives
Relative return objectives
Constraints
Liqudity
Time horizon
Tax concerns
Legal and regulatory
Unique circumstances
Investment guidelines
Evaluation and review
Appendices
Portfolio construction
The strategic asset allocation (SAA)
Definition: the set of exposures to IPS- permissible asset classes that is expected to achieve the client's long- term objectives given the client's risk profile and investment constraints
Asset class
定义: a category of assets that have similar characteristics, attributes, and risk/return relationships
特点
Correlations of returns of assets within an asset class should be relatively high
Correlations of returns between asset classes should be low
Tactical asset allocation: is the decision to deliberately deviate from the policy exposures to systematic risk factors (i.e., the policy weights of asset classes) with the intent to add value based on forecasts of the near- term returns of those asset classes
Security selection: is an attempt to generate higher returns than the asset class benchmark by selecting securities with a higher expected return
The Behavioral Biases of Individuals
Definition of behavior financial
Traditional finance
Individuals are assumed to be risk-averse, self interested, utility-maximizers who process available information in an unbiased way (rational)
Hypothesizes that, at the market level, prices incorporate and reflect all available and relevant information
Behavioral finance: includes behavioral economics, investor psychology, behavioral science, experimental economics, and cognitive psychology
Cognitive errors and emotional bias
Cognitive error
Definition: Individual try to process information into rational decisions, but they simply lack the capacity or sufficient information to do so; more easily to be corrected
Types
Belief perseverance biases
定义: reflect an inclination to maintain beliefs. The belief is maintained by committing statistical, information-processing, or memory errors
Types
Conservatism bias
Definition: people maintain their prior views or forecasts by inadequately incorporating new information (强调不能很好接受新信息)
Consequence
Maintain or be slow to update a view or a forecast, even when presented with new information
Opt to maintain a prior belief rather than deal with the mental stress of updating beliefs given complex data
应对: properly analyzing and weighting new information
Confirmation bias
Definition: Individuals tend to notice only information that agrees with their perceptions or beliefs
Consequence
Consider only the positive information
Develop screening criteria and then ignore informationthat opposites
Under-diversify portfolio
应对: actively seeking out information that challenges your beliefs
Representativeness bias
Definition: people tend to classify new information based on past experiences and classifications
Consequence
Adopt a view or a forecast based almost exclusively on new information or a small sample
Update beliefs using simple classifications rather than deal with the mental stress of updating beliefs given complex data
应对: asking FMPs if they are failing to consider the base rate or neglecting the lawof small numbers
Illusion of control
Definition: people tend to believe that they can control or influence outcomes when, in fact, they cannot
Consequence
Believe that they have "control" over the outcomes of their investments, which leads to excessive trading
Inadequately diversify portfolios
应对: keeping the record
Hindsight bias
Definition: A bias with selective perception and retention aspects. People may see past events as having been predictable and reasonable to expect
Consequence
Overestimate the degree to which they predicted an investment outcome
Cause FMPs to unfairly assess money manager or security performance
应对: keeping the record and examine their investment decisions
Information-processing biases
Result in information being processed and used illogically or irrationally
Types
Anchoring and adjustment,
Definition: people generally begin by envisioning someinitial default number and "anchor" which they then adjust up or down to reflect subsequent information and analysis
Consequence: may stick too closely to their original estimates when new information is learned
案例: 衣服还价时,店铺老板往往会给一个远高于成本价的出价,这样顾客还价就不会离这个初始价格太远,保证商家有利可图
应对: remembering that the past prices, market level and reputation provide little information about an investment`s future potential and thus should not influence buy-and-sell decisions
Mental accounting bias
Definition: people treat one sum of money differently from another equal-sized sum based on which mental account the money is assigned to
Consequence
Do not care about optimal diversification
Neglect opportunities to reduce risk by combining assets with low correlations
Irrationally distinguish between returns derived from income and those derived from capital appreciation
应对: focus on total return and risk
Framing bias
Definition: a person answers a question differently based on the way in which it is asked (framed)
Consequence
Misidentify risk tolerances because of how questions about risk tolerance were framed
May become more risk-averse when presented with a gain frame of reference and more risk-seeking when presented with a loss frame of reference
Choose suboptimal investments, based on how information about the specific investments isframed
Focus on short-term price fluctuations, which may result in excessive trading
案例: 一场流行性疾病可能会夺去6万人的生命。现在有两种方案——方案A和方案B。问:如果采取方案A将很可能拯救2万人的生命,而采取方案B,有三分之一的概率6万人都会得救但是有三分之二的概率一个人都活不了,大多数人可能会选择A
应对
Being neural and open-minded as possible when interpreting investment-related situations
Focus on net income and losses
Availability bias
Definition: is an information-processing bias in which people estimate the probability of an outcome or the importance of a phenomenon based on how easily information is recalled
Sources
Retrievability
Categorization
Narrow range of experience
Resonance
Consequences
Limit their investment opportunity set
Choose an investment, investment adviser, or mutual fund based on advertising or the quantity of news coverage
Fail to diversify
应对
Develop an appropriate investment policy strategy
Carefully research and analyze investment decisions before making them
Focus on long-term historical data
Emotional biases
Definition: are harder to correct for than cognitive errors because they originate from impulse or intuition rather than conscious calculations
Types
Loss aversion bias
Definition: people tend to strongly prefer avoiding losses as opposed to achieving gains
Consequences
Hold investments in a loss position longer
Sell investments in a gain position earlier
Limit the upside potential of a portfolio by selling winners and holding losers
Trade excessively as a result of selling winners
Excessive trading has been shown to lower investment returns
应对: disciplined approach to investment based on fundamental analysis
Overconfidence bias
Definition: people demonstrate unwarranted faith in their own intuitive reasoning, judgments, and/or cognitive abilities
Consequences
Self-attribution bias, the combination of self-enhancing bias and self-protecting bias, contributes to overconfidence
Overestimating knowledge levels, abilities, and access to information
Underestimate risks and overestimate expected returns
Hold poorly diversified portfolios and trade excessively
应对: objective when making investment decisions
Self-control bias
Definition: people fail to act in pursuit of their long-term, overarching goals because of alackof self-discipline. There is an inherent conflict between short-term satisfaction and achievement of some long- term goals
Consequences
Save insufficiently for the future
Accept too much risk in their portfolios
Cause asset allocation imbalance problems prefer income-producing assets in order to have income to spend
应对: writing down the plan, so that they can be reviewed regularly
Status quo bias
Definition: an emotional bias in which people donothing(i.e.,maintain the "status quo") instead of making a change
Consequences
Unknowingly maintain portfolios with risk characteristics that are inappropriate for their circumstances
Fail to explore other opportunities
案例: 投资者A就职于某一线城市设计总院,了解大量规划信息,同时单位也未要求严格保密,但A一直比较闲散,上班以摸鱼为第一要务,疏于整理归集信息,错过很多投资机会
Endowment bias
Definition: people value an asset more when they hold rights to it than when they do not
Consequences
Fail to sell off certain assets and replace them with other assets
Maintain an inappropriate asset allocation
Continue to hold classes of assets with
应对
鼓励卖出继承的证券等资产,因为上一代的投资风格不一定适合自己
对继承的现金资产做多元化配置
Regret-aversion bias
Definition: people tend to avoid making decisions that will result in action out of fear that the decision will turn out poorly
Consequences
Be too conservative in their investment choices as a result of poor outcomes on risky investments in the past.
Engage in herding behavior
案例: A因为买入一只股票后,市场遭遇经济危机,因为害怕股票卖出亏损后又涨回来,收到家人的责难,所以选择不做任何反应
应对
识别量化出自己分散化操作的好处
认识到损失对所有人都是在所难免的,波动性是市场的本质
应对: by education, but it is hard to correct
How behavorial finance influences market behavior
Defining market anomalies
Momentum
Bubbles and crashes
Value (halo effect)
Introduction to Risk Management
The risk management process
Terms
Risk: is exposure to uncertainty
Risk exposure: the extent to which the underlying environmental or market risks result in actual risk borne by a business or investor who has assets or liabilities that are sensitive to those risks
Risk management: the process by which an organization or individual defines the level of risk to be taken, measures the level of risk being taken, and adjusts the latter toward the former, with the goal of maximizing the company's or portfolio's value or the individual's overall satisfaction, or utility
Process
Risk governance
Risk identification and measurement
Risk infrastructure
Defined policies and processes
Risk monitoring, mitigation, and management
Communications
Strategic analysis or integration
Risk governance
An Enterprise View of Risk Governance: Provides an enterprise-view of risk management
Risk Tolerance
Serve as the high-level guidance for management in its strategic selection of risks
Focus on what is and is not acceptable
Risk Budgeting
The risk budget is a further extension of risk tolerance
Allocates permitted risk to strategic allocation, tactical allocation, and security selection
Focus on where and how risk is taken
Identification of risks
Financial risks
Market risk: Risks that arise from movements in interest rates, stock prices, exchange rates, and commodity prices
Credit risk: Risk of loss if one party fails to pay an amount owed on an obligation (e.g.,bond, loan, derivative) to another party
Liquidity risk: Risk of a significant downward valuation adjustment when selling a financial asset., which is measured by bid-ask spread
Non-financial risks
Settlement risk: Closely related to default risk but deals more with the settling of payments that occur just before a default
Legal risk: The risk of being sued over a transaction. (fraud)
Model risk: The risk of a valuation error from improperly using a model
Tail risk: More events in the tail of the distribution than would be expected by probability models
Operational risk: Risk that arises from the people and processes that combine to produce the output of an organization
Solvency risk: Risk that the entity does not survive or succeed because it runs out of cash, even though it might otherwise be solvent
Compliance risk: It is directly related to the third party supervision department
Interactions between risks: Risks do not usually arise independently, but generally interact withone another, a problem that is even more critical in stressed market conditions
Measurement of market risk
Probability
Standard deviation
Beta
Sensitivity (Delta, Gamma, Vega, Rho, Duration)
Value at Risk (VaR) and Conditional VaR (CVaR)
Extreme value theory
Scenario analysis and stress testing
Technical Analysis
Definition and Scope
Definition: Technical analysis is a form of security analysis that uses price andv olume data, which is often graphically displayed, in decision making
Principles and Assumptions
Principles
Prices are determined by the interaction of supply and demand
Technicians believe that humans are often irrational and emotional and that they tend to behave similarly in similar circumstances
Only those market participants who actually buy or sell asecurityhave an impact on price
Assumptions
Market prices reflect both rational and irrational investor behavior
Investor behavior is reflected in trends and patterns that trend to repeat and can be identified and used for forecasting prices
Efficient markets hypothesis dose not hold
Technical and Fundamental Analysis
Comparison
Fundamental analysis of a firm attempts to determine the intrinsic value of an asset by using the financial statements and other information
Technical analysis uses only the firm's share price and trading volume data, and it is not concerned with identifying buyers' and sellers' reasons for trading, but only with the trades that have occurred
Fundamentalists believe that prices react quickly to changing stock values, while technicians believe that the reaction is slow
Advantages of technical analysis
Actual price and volume data are observable
Technical analysis itself is objective (although require subjective judgment), while much of the data used in fundamental analysis is subject to assumptions or restatements
It can be applied to the prices of assets that do not produce future cash flows, such as commodities
It can also be useful when financial statement fraud occurs
Disadvantage: The usefulness is limited in markets where price and volume data might not truly reflect supply and demand, such as inilliquid markets and in markets that are subject to outside manipulation
Technical Analysis Tools
Charts
Two axes
Horizontal axis: usually time interval (daily, weekly, monthly)
Vertical axis: Price
Types of charts
Line charts: the simplest technical analysis charts, which show closing prices for each periods as a continuous line
Bar charts: add the high and low prices for each trading period and often include the opening price and closing price as well
Candlestick charts
特点: use the same data as bar charts but display a box bounded by the opening and closing prices
Types
Box is clear: closing price>opening price;
Box is filled: closing price<opening price
Point and figure charts
Application: helpful in identifying changes in the direction of price movements
Description
Starting form opening price;
X: increase of one box size, O: indicate a decrease
Analyst will begin the next column when the price changes in the opposite direction by at least the reversal size (3 times the box size)
Relative strength analysis
Positive relative strength: an increasing trend indicates that the asset is outperforming the benchmark
Negative relative strength: an decreasing trend indicates that the asset is underperforming the benchmark
Trend (the most basic concept in technical analysis)
Types
Uptrend: prices are consistently reaching higher highs and retracting to higher lows (Demand>Supply)
Downtrend: prices are consistently reaching higher lows and retracting to lower highs (Demand<Supply)
Trend line: can help to identify whether a trend is continuing or reversing
Uptrend line: connects the increasing lows in prices
Downtrend line: connects the decreasing highs in prices
When prices crosses the trend line by what the analyst considers a significant amount, a breakout form a downtrend or a breakdown form an uptrend is said to occur
Terms
Support level: buying is expected to emerge that prevents further price decreases
Resistance level: selling is expected to emerge that prevents further price increases
Change in polarity: breached resistance levels become support levels and that breached support levels become resistance levels
Chart Patterns
Reversal patterns
For uptrend: Head-and shoulders pattern, double top and triple top
Head-and-shoulders pattern is used to project a price target for ensuing downtrend
The size of the head-and-shoulders pattern: the difference in price between the head and the neckline
For downtrend: inverse head-and shoulders pattern, double bottom, and triple bottom
Continuation patterns
Triangles: form when prices reach lower highs and higher lows over a period of time
Rectangles: form when trading temporarily forms a range between a support level and a resistance level
Flags and pennants: refer to rectangles and triangles that appear on short term price charts
Price target
Price target = Neckline – (Head – Neckline)
Inverse head and shoulders pattern: price target = neckline+(neckline – head)
Technical indicators
Price-based
Moving average lines
Definition: the average of the closing price of a security over a specified number of periods
Application
Technicians commonly use a simple moving average, which weights each priceequallyin the calculation of the average price
Some technicians prefer to use an exponential moving average (also called an exponentially smoothed moving average), which gives the greatest weight to recent prices while giving exponentially less weight to older prices
Trading strategy
First, whether price is above or below its moving average is important. A security that has been trending down in price will trade below its moving average, and a security that has been trending up will trade above its moving average
Second, the distance between the moving-average line and price is also significant. Once price begins to move back up toward its moving-average line, this line can serve as a resistance level
When a short-term moving average crosses from underneath a longer-term average, this movement is considered bullish and is termed a golden cross
When a short-term moving average crosses from above a longer-term average, this movement is considered bearish and is termed a dead cross
Bollinger bands
Moving average: +/-2σ
Trading strategies
Investor sells when a security price reaches the upper band and buys when it reaches the lower band. (This strategy assumes that the security price will stay within the bands)
The long-term investors might actually buy on a significant breakout above the upper boundary band and sell on a significant breakout below the lower band
Momentum oscillators
Rate of change oscillator
Relative Strength Index (RSI)
公式
评价
An RSI is based on the ratio of total price increases to total price decreases over a selected number of periods, which is scaled to oscillated between 0 and 100
High values (typically those greater than 70) indicating an overbought market
Low values (typically those less than 30) indicating an oversold market
Stochastic oscillator
公式
Description
The absolute level of the two lines should be considered inlight of their normal range
Movements above this range indicate to a technician an overbought security and are considered bearish; movements below: oversold security and are considered bullish
Crossovers of the two lines
When the %K moves from below the %D line to above it, this move is considered a bullish short-term trading signal
When the %K moves from above the %D line to above it, this move is considered a bearish short-term trading signal
Moving average convergence/divergence (MACD)
Definition: The MACD is the difference between a short-term and a long-term moving average of the security's price
Constructed by
MACD line: difference between two exponentially smoothed moving averages, generally 12 and 26 days
Signal line: exponentially smoothed average of MACD line, generally 9 days
Sentiment
Put/call ratio: put option volume divided by call option volume
Extremely high ratios indicate strongly bearish investor sentiment and possibly an oversold market
Extremely low ratios indicate strongly bullish sentiment and perhaps an overbought market
Volatility Index:
Measures the volatility of options on the S&P 500 stock index
High level sof the VIX suggest investors fear declines in the stock market
Margin debt
When stock margin debt is increasing, investors are aggressively buying and stock prices will move higher because of increased demand
Falling prices may trigger margin calls and forced selling, thereby driving prices even lower
Short interest ratio
Short interest ratio = Short interest / Average daily trading volume
A high short interest ratio means investors expect the stock price to decrease, it also implies future buying when short sellers must return their borrowed shares
Flow of funds
Short-term trading index (TRIN)
公式
Description
Index value close to 1 suggests funds are flowing about evenly to advancing and declining stocks
Index values greater than 1 mean the majority of volume is in declining stocks
Index less than 1 means more of the volume is in advancing stocks
Margin debt
Mutual fund cash position: Technical analysts typically view mutual fund cash as a contrarian indicator. When mutual funds accumulate cash, this representsfuture buying power in the market. A high mutual fund cash ratio therefore suggests market prices are likely to increase
New equity issuance: Issuers tend to sell new shares when stock prices are thought to be high, increases in issuance of new shares may often coincide with market peaks
Fintech in Investment Management
Introduction
Definition: The term fintech refers to developments in technology that canbeapplied to the financial services industry
Some primary areas fintech is developing
Increasing functionality to handle large sets of data that may come from many sources and exist in a variety of forms
Tools and techniques such as artificial intelligence for analyzingvery large data sets
Automation of financial functions such as executingtradesandproviding investment advice
Emerging technologies for financial recordkeeping that mayreduce the need for intermediaries
Types of technology
Big data
Definition: a widely used expression that refers to all the potentially useful information that is generated in the economy
Characteristics
Volume
Velocity
Variety
Sources
Financial markets
Businesses
Governments
Individuals
Sensors
Internet of Things
Big Data Challenges: the quality, volume, and appropriateness of the data
Artificial Intelligence and Machine Learning
Artificial Intelligence
Machine Learning
特点
Involves computer- based techniques that seek to extract knowledge from large amounts of data without making any assumptions on the data's underlying probability distribution
The emphasis is on the ability of the algorithm to generate structure or predictions without any help from a human
"find the pattern, apply the pattern"
Types
Supervised learning
Unsupervised learning
Deep learning
Selected Applications of Fintech to Investment Management
Text Analytics and Natural Language Processing
Robo- Advisory Services
Risk Analysis
Algorithmic Trading
Distributed Ledger Technology (DLT)
Definition: A distributed ledger is a type of database that may be shared among entities in a network
Blockchain: is a type of digital ledger in which information, such as changes in ownership, is recorded sequentially within blocks that are the nlinked or "chained" together and secured using cryptographic methods
Applications of DLT to Investment Management
Cryptocurrencies
Tokenization
Post- trade clearing and settlement
Compliance