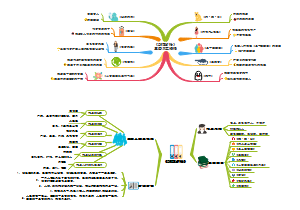
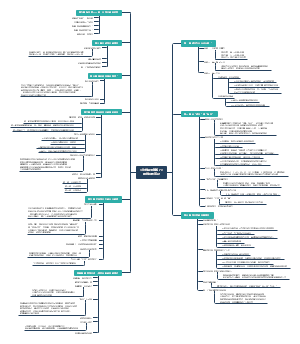
导图社区 经济系GDP思维导图(纯英版)
经济系关于GDP的思维导图、The change in real GDP is the amount that GDP would change if prices were constant (i.e., if zero inflation).
Probability Distributions:1. Ramdom Variables 2. Discrete Probability Distributions 3. Continuous Probability Distributions
社区模板帮助中心,点此进入>>
论语孔子简单思维导图
《傅雷家书》思维导图
《童年》读书笔记
《茶馆》思维导图
《朝花夕拾》篇目思维导图
《昆虫记》思维导图
《安徒生童话》思维导图
《鲁滨逊漂流记》读书笔记
《这样读书就够了》读书笔记
妈妈必读:一张0-1岁孩子认知发展的精确时间表
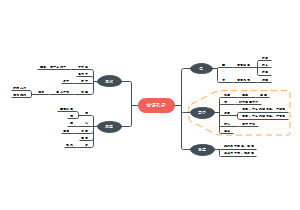
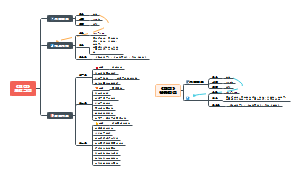
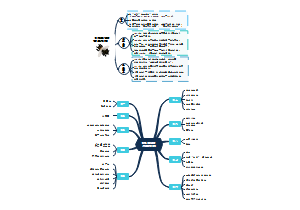
Introduction and GDP
Cyclinical and Short-Run changes
GDP can measure short run reflection
Assume the population is fixed
Recession
A significant, widespread decline in real GDP and employment.
Business Fluctuations (or business cycles)
Short-run movements in real GDP around its long-term trend.
Example: Business cycle peaks/troughs
Spliting GDP
1. National spending approach – add up the components of spending
NX=Exprts -Imports
Net Exports
The value of exports minus the value of imports
2. Factor income approach – add up the income generated by producing goods and services
When a consumer spends money, the money is received by workers, landlords, owners of capital, and businesses.
We can therefore calculate GDP by adding up all of the incomes received.
An important equivalence
GDP
Production
Spending
Income
Welfare
How to measure
Nominal GDP
Using prices at the current year
Nominal GDP in 2011 = ∑ P2011 x Q2011
Real GDP
measured using constant prices from the base year (2011 in this example).
Nominal vs Real GDP
values output using current prices
not adjusted for inflation
Increases in production, not increases in prices, improve the standard of living.
values output using the prices of a base year
is adjusted for inflation
The change in real GDP is the amount that GDP would change if prices were constant (i.e., if zero inflation).
The change in nominal GDP reflects both prices and quantities.
Limitation
Can’t tell if an increase in nominal GDP was due to greater production (Q) or increased prices (P).
Creates problems when comparing GDP over time
Definition
Real GDP per capita
Growth in real GDP per capita is usually the best reflection of changing living standards.
a rough measure of a country's standard of living
Example: China's miracle
Gross domestic production (GDP)
The market value of all finished goods and services produced within a country in a year.
Market value
To determine the value of goods and services
Finished
Intermediate goods are not included
Goods and Services
Services are also the outputs of an economy
Produced
Sales of old houses, used goods and financial assets are not included
In a year
GDP per capita
GDP divided by population.
Gross national product (GNP)
The market value of all finished goods and services produced by a country’s permanent residents, wherever located, within a year.
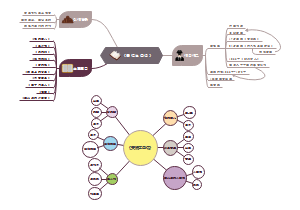
The Circular-Flow Diagram
Intro
a simple depiction of the macroeconomy
illustrates GDP as ‘spending’, or ‘revenue' factor payments, and income’
Households
own the factors of production, sell/rent them to firms for income
buy and consume goods & services
Firms
buy/hire factors of production, use them to produce goods and services
sell goods & services
Preliminaries
Factor of prodcution
inputs like labor, land, capital, and natural resources.
Factor of payments
payments to the factors of production (e.g., wages, rent).
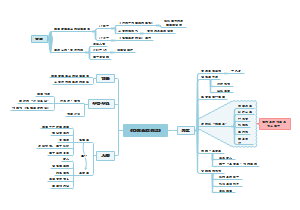
Problems with GDP
Illegal or underground-market transactions are omitted from GDP.
GDP does not count nonpriced production when valuable goods and services are produced but no monetary payment is made.
Causes biases over time and biases across nations
GDP adds up the value of finished goods and services but does not subtract the value of bads.
Pollution
Changing supplies of natural resources
Loss of animal or plant species
Crime
Environmental amenities (pleasantness) are difficult to value.
GDP does not count the health of nations.
Micro vs Macro
Micro
The study of how individual households and firmsmake decisions, interact with one another in markets.
Macro
The study of the economy as a whole.
GDP Deflator
Introduction
The GDP Deflator is a price index that can be used to measure inflation.
GDP Deflator is the ratio of nominal to real GDP, times 100