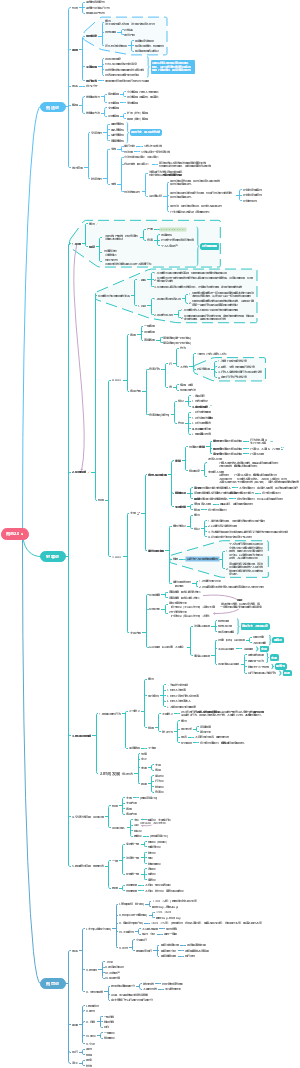
Portfolio Management: An Overview
Steps in portfolio management process
Type of investors
Individual investors
Defined contribution (DC) pension plan
Institutional investors
Defined benefit (DB) pension plan
Endowments and foundations
Characteristics and needs
Pooled Investments
Mutual funds
Open-end funds
buy and redeem at net asset value (NAV)
Closed-end funds
traded at a premium or discount to net asset value
Exchanged traded funds (ETF)
Portfolio Risk and Return: Part I
Measurements of return
Average return (Arithmetic return)
Time-weighted return (TWR)
Money-weighted return (MWR)
Measurements of risk
Population variance and standard deviation
Sample variance and standard deviation
Portfolio Risk and Return: Part II
Capital allocation line (CAL)
Capital market line (CML)
RIght: borrowing portfolio
Systematic risk
Beta
how sensitive return to market
Unsystematic risk
well-diversified portfolios
Capital Asset Pricing Model (CAPM)
Security market line (SML)
Basics of Portfolio Planning and Construction
Risk objectives
Willingness to bear risk
ability > willingness
educate investor about risk, but not change
Investment constraints (TTLLU)
Unique needs and perferences
Strategic asset allocation
<- optimization and/or simulation
<- Long-term capital market expectations
<- Investment objectives and constraints (IPS)
Portfolio Construction
1. Construct an efficient frontier
2. Strategic asset allocation
3. Tactical asset allocation
Temporarily away from strategic asset allocation
ESG considerations
Implementation approaches
The Behavioral Basies of Individuals
Behavioral biases and categorizations
Belief perseverance biases
Confirmation bias
Keywords
ignore negative information
Consequences
hold investments too long
consider only positive information on existing investment
ignore some good investment
under-diversified portfolios
Representativeness bias
keywords
classify new information based on past experiences and classifications
Hindsight bias
keywords
past events predictable and reasonable to expect
Information processing errors
Framing bias
Consequences
misidentify risk tolerances
Avaiability bias
keywords
retrievability, categorization, narrow range of experience, resonance
Consequences
choose based on advertising
Mental accounting bias
keywords
mentally into "accounts" layered pyramid format
consequences
overemphasis on income generating assets
Anchoring and adjustment bias
keywords
reply on initial piece of information
consequences
stick to original estimates
Emotional biases
Loss-aversion bias
Consequences
Disposition effect
Hold investment in a loss position loner than justified
Sell investments earlier than justified
Self-control bias
Consequences
save insufficiently for future
Regret-aversion bias
Consequences
engage in herding behabior
Under-diversified portfolios
Maintain existing positions
Introduction to Risk Management
Risk management framework
Risk governance
top-down process to overall enterprise
Risk identification and measurement
Risk monitoring, mitigation and management
Strategic analysis and integration
Elements of effective risk governance
Enterprise risk management
Risk tolerance (risk appetite)
Risk Management Process
Identification
Non-financial risk
Settlement risk
occur just before a defaul
Measurement
Value at Risk (VaR) and Conditional VaR (CVaR)
minimum loss for a given period at a given level of probability
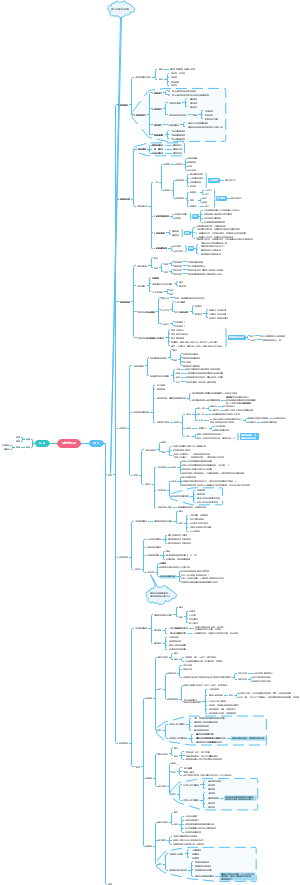
Technical Analysis
Technical analysis
using price and volume data
Assumptions
price already reflects all known factors
price action is repetitive
Charts
Bar
high, low, opening and closing prices
Candlestick
high, low , opening and closing prices
Box
Clear/white: closing > opening
filled/dark/shaded: closing<opening
Relative strength analysis
compare asset with benchmark using line chart
relative strength ratio = price of asset / benchmark
trend
uptrend
higher highs and higher lows
uptrend line: connect lows
downtrend
lower highs and lower lows
downtrend line: a line connecting highs
Common chart patterns
reversal patterns
head-and-shoulders
uptrend -> downtrend
price target = neckline - (head - neckline)
downtrend -> uptrend
price target = neckline + (neckline - head)
double tops and bottoms
uptread -> downtrend
price target = neckline - (head -neckline)
downtrend -> uptrend
price target = neckline + (neckline - head)
continuation patterns
triangle patterns
sysmmetrical triangle
price target = up trendline + difference in price from two trendlines at the start
ascending triangle
price target = horizon price + difference in price at start
descending triangle
low prices from trendline and high prices from lower and lower highs
rectangles
bullish
price objective = breakout level + width of rectangle
bearish
price objective = breakout level - width of rectangle
flags and pennants
trendlines slope of flags in direction opposite to the trend
Technical indicators
price-based
Moving average
bullish crossover (golden cross)
short-term cross long-term from underneath
bearish crossover (dead cross)
short-term cross long-term from above
strategy
buy bullish and selling bearish
Bollinger bands
moving average +/- a set of number * o
moving-average line with upper and lower lines
Ballinger band width = ((upper band - lower band)/middle band)*100
squeeze: volatility falls to a very low level and narrowing bands
momentum oscillators
Rate of Change Oscilator (ROC)
Relative strength index (RSI)
Application to portfolio management
Fintech in Investment Management
Big Data
Non-traditional data (alternative data)
Artifical Intelligence (AI)
Machine Learning (ML)
training dataset, validation dataset and test dataset
Overfitting may lead to prediction errors
Application
Text analytics
identify future performance
Natural language processing (NLP): analyze and interpret human language
Robo-advisory services
passive investment approach
Distributed Ledger Technology (DLT)
Pros
create, exchange and track ownership on a peer-to-peer basis
greater accuracy, transparency and security